
Abstract
The shrink swell test, which combines both the shrink strain and the swell strain, was developed in Australia in the 1980s. This test now underpins a codified approach to the foundation design of lightweight buildings on expansive (reactive) soils in Australia and New Zealand.
The foundations for thousands of houses and other lightweight structures are designed in accordance with AS 2870:2011 based on the site soil class derived from the shrink swell index (ISS), determined using the shrink swell test, AS 1289:2003. A major appeal of this test is that, with AS 2870:2011, there is clear foundation design guidance for any site soil-class.
Auckland, like many Australian cities, is underlain by expansive soils. The requirement for shrink swell testing has been codified and mandated in New Zealand since 2011. As a result, there is now a substantial dataset of shrink swell test results from New Zealand, as well as Australia (where the test has been utilised in the assessment of expansive soils for more than 20 years).
A fundamental rationale for using the shrink swell test is that it evaluates the soil over both wetting (swell) and drying (shrink) phases, so the result is independent of the initial moisture state of the soil sample, and defines a unique soil class related to the fundamental properties of the soil.
However, recent analysis of shrink swell test results from a site of single geological origin in Auckland identified a significant variation in the shrink swell index values, which are not independent of the initial moisture content of the test samples, but rather are correlated with it.
Subsequent analyses of other datasets showed a similar trend, strongly suggesting that the soil classes are being unduly influenced by the initial moisture content, rather than by differences in the soil properties. Simply put, the wetter the soil, the higher the shrink swell index.
This paper sets out the results of a critical examination of datasets of shrink swell tests undertaken in Auckland, New Zealand and Victoria, Australia and concludes that based on these datasets the shrink swell test has a significant shrink strain bias which makes it unreliable as the sole basis for foundation design guidance on expansive soils.
I. INTRODUCTION
The problems with expansive soils have been recognised internationally for more than 50 years, and although expansive soils occur widely in the US, the UK, India, South Africa, Australia and China, there is no internationally recognised test for soil shrink swell potential.
In the UK, buildings supported on London Clay became damaged following the major Dutch elm disease outbreak in the 1970s. After the death of millions of trees, the soils subsequently swelled, damaging hundreds of buildings. The UK National House Building Council (NHBC) now use a modified Plasticity Index (PI) to assess the expansivity (volume change potential) of soils.
Climate change is expected to increase the damage due to expansive soils globally as climatic extremes widen and droughts become more frequent and severe.
In Australia, some 20% of the land is covered by expansive soils, including 6 of the 8 major cities. Because the problem is so widespread, standards have been developed in Australia both for the testing of shrink swell (AS 1289:2003) and for a design approach to address the problem with foundation design on expansive soils (AS 2870:2011).
In New Zealand, the most expansive soils occur in the Auckland and Northland regions with clay soils containing high proportions of montmorillonite. The problems with expansive soils in Auckland first became a major geotechnical issue in the 1970s when a significant number of relatively new buildings, in new subdivisions in the Auckland suburb of Pakuranga became damaged during and after particularly dry summers.
The expansive soils data from beneath the damaged houses in Auckland are summarized in a paper by Wesseldine (1980). In the droughts of 1973 and 1974, 72 houses in Auckland were damaged by soil shrinkage. Most of the soils beneath the damaged houses had a Liquid Limit (LL) greater than 55 and a Plasticity Index (PI) greater than 30. Those droughts were estimated to have a return period of about 20 years.
II. Approach to the assessment of expansive soils in New Zealand
In New Zealand, building construction is governed by the Building Act 2004 and associated performance-based building codes. However, like Australia, standard foundation designs have been developed for lightweight buildings, and in New Zealand these are set out in the design standard, NZS 3604:2011. This standard applies to buildings supported by “good ground”.
The identification and assessment of expansive soils has been a requirement of NZS 3604 since 1990 and a requirement for residential land development more recently.
Expansive soils are excluded from the definition of “good ground”. In NZS 3604:2011 expansive soils are defined as soils with a liquid limit (LL) greater than 50% (as tested by NZS 4402:2.2:1986), and a linear shrinkage (LS) greater than 15% (as tested by NZS 4402:2.6:1986).
NZS 3604:2011 is used to design over 90% of homes and other low-rise, timber-framed buildings in New Zealand and this standard has been around (in one form or another) since the aftermath of the Napier earthquake in 1931. It provides prescribed methods for the design and construction of low-rise, timber-framed buildings to meet the requirements of the Building Code, without the need for specific engineering design.
The Earthworks and Geotechnical Requirements for Land Development and Subdivision are set out in Section 2 of the Auckland Council Code of Practice dated 24 September 2013 (Version 1.6).
Expansive soils (in Australia termed reactive soils) are soils with high shrinkage and expansion potential, and these are recognised as “special soil types” (section 2.3.5) in the Auckland Council Code of Practice.
In section 2.6 of the Code of Practice, the following requirements are to be included (section 2.6.1) in the geotechnical completion report (GCR).
“For all developments where a geo-professional is engaged, the geo-professional shall submit a geotechnical completion report to the developer and the UA accompanied by a statement of professional opinion set out in Schedule 2A. The geotechnical report shall identify any specific design requirements which would necessitate the building design deviating from NZS 3604.
The expected level of site movement from reactive soil (expansive soils) under AS2870:1996 shall be identified by their respective class and included in the geotechnical completion report (GCR). The soil properties used in determining the class are to be recorded in the report.”
In NZS 3604:2011, if the soils meet the definition of expansive soils, then the building designer is referred to section 17 (expansive soils), which in turn refers the designer to various site soil classes described in
AS 2870:1996.
AS 2870:1996 had four (4) site soil classes, slightly (S), moderately (M), highly (H) and extremely (E) expansive. The standard has since been updated (AS 2870:2011) and now contains five (5) classes, with the H being split into H1 and H2. Whereas H went to 70mm, H2 now goes to 75mm.
Prior to the adoption of the shrink swell test in New Zealand, the assessment of soil expansiveness was binary. If the soil was not expansive then, provided it passed other tests for strength and compressibility, the soil was classified as “good ground” and standard foundation designs could be applied to lightweight timber-framed buildings.
However, if the soils were expansive, then irrespective of other properties of strength and compressibility, these soils were excluded from the definition of “good ground”, and the building foundations required specific design. Engineering judgement would then need to be applied to determine appropriate foundation depths and slab reinforcement. This remained the procedure until the shrink swell test was incorporated into
NZS 3604.
With the adoption in New Zealand of the shrink swell test and the site soil classification system based on the shrink swell index, less reliance has been placed on the LL and LS testing, and more reliance is placed on the shrink swell test. One of the reasons for this has been the published results of research in Australia which has found poor or unreliable correlations between the shrink swell index and Atterberg test results, in particular, LL and LS. In November 2019, MBIE changed back to 4 site soil classes, but with different thresholds.
III. The shrink swell test
A good summary of the shrink swell test, explaining its efficacy and history, is provided by Fityus et al. (2005). The need for an effective measure of swell potential had long been recognised as necessary to take out the initial moisture content bias from core shrinkage tests. Wet soils would shrink a lot, but dry soils would shrink little. Measuring soil expansion was both complex and problematic. However, a simplified procedure was developed which bypassed the need for measuring soil suction, based on a number of important assumptions.
A key assumption, based on the collective experience of the AS 2870 code committee members on expansive soils, was that the magnitude of the suction change that corresponds to the soil volume change equals 1.8pF units for all soils.
Another assumption was that whilst the soil shrinkage test was unconstrained (the soil could freely shrink in all directions), the swell test was confined in an oedometer ring. It was assumed that this lateral restraint would be redirected into the vertical direction, thereby overestimating the swell strain. It was therefore decided to divide the swell strain in half.
Accordingly, the committee decided that the shrink swell test could be made attractive to routine geotechnical practice by adopting these values for all soils, in all tests, and thereby circumventing the need to determine suctions through direct measurement. The shrink swell index is therefore defined as:
![]()
The justifications for the assumed values of 2 and 1.8 are well canvassed in Fitysus (2005). The shrink swell index
(ISS) value is then used to calculate the characteristic soil movement at the ground surface (y S), which enables the placement of the soils into a particular soil class under
AS 2870:2011. This standard does suggest variations based on rainfall and the Thornthwaite Moisture Index (TMI) of the soil.
A number of assumptions also need to be made in taking the values to obtain values. For Auckland conditions it is usual to assume values of Hs =1.5 and
![]() The crack depth is typically assumed to be .
The crack depth is typically assumed to be .
![]()
For Auckland soils the correlation between shrink swell index and the characteristic surface movement is set out in a study for BRANZ by Brown et al (2008) according to the table below:
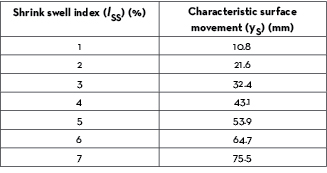
In effect, all else being equal, this indicates that the characteristic surface movement at the ground surface (y S in mm) can be taken as approximately 11 times the shrink swell index (ISS) value for a 300 year return period (RP) drought.
For shorter or longer return periods, the BRANZ report suggested the following scaling factors:

Accordingly, for Auckland soils this gives in the following correlations:

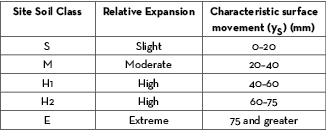
Depending upon the y S values, the soil tested is assigned a corresponding site soil class. The site soil classes in AS 2870:2011 are:
In November 2019, MBIE made the following amendment to the site soil classes in New Zealand
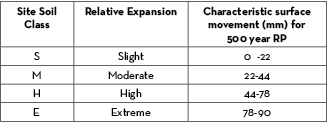
MBIE also changed the performance requirements for expansive soils to be: SLS for a 500 year RP drought and ULS for a 1000 year RP drought.
The slightly expansive soil classification (S) is not entirely consistent NZS 3604, which classifies “good ground” as soils which shrink and swell less than 25mm.
AS 2870 suggests that the frequency of testing for expansive soils should be about 3 tests per residential allotment (site), but that for subdivisions where the soils are fairly uniform in both depth and extent the frequency could be one test per 3-5 sites. This latter approach has been adopted for soil index testing on subdivision blocks and stages in Auckland.
Depending on the site soil class, the foundations of the buildings in the block can then be designed using standard design approaches set out in AS 2870.
Soil shrink swell testing has therefore been routinely undertaken on blocks, within subdivision stages. Based on the test results, these blocks have been put into site soil classes.
The site soil classes are then reported in a GCR, which does not usually make foundation recommendations, leaving the foundation design to the particular building designer.
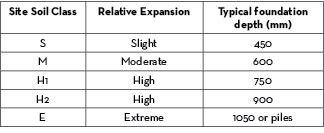
The site soil classifications are routinely used to determine both foundation type and foundation depth, such as:
IV. Ground surface movements and site soil classes
The ability of the shrink swell test to accurately predict ground movements was considered in a major experimental study by Cameron (1989). That study, and subsequent studies by Fityus (1996) appeared to confirm that the shrink swell test gave an accurate indication of the expansiveness of a soil, and that the simplified shrink swell index value could be used to give an accurate prediction of soil surface movement.
The cost and time of the shrink swell test was seen as an impediment, and hence there has been a lot of work looking at possible correlations between other established measures of soil behavior, including liquid limit, plastic limit (PL), and linear shrinkage. Most studies have generally concluded that there is no reliable relationship. Accordingly, it does not appear that simpler and less expensive tests which measure LL, PL or LS can substitute for carrying out a shrink swell test, nor (perhaps more importantly) vice versa.
An apparent advantage of the shrink swell test over the Atterberg tests is that the latter are undertaken on “remoulded and screened soils, whereas the shrink swell tests are usually conducted on relatively undisturbed natural soil specimens, sampled with “thin walled sampling tubes””. Moreover, the shrink swell test can be “reliably performed by laboratory technicians with limited experience, with relatively rudimentary laboratory equipment and at relatively low cost.”
For these reasons the shrink swell test has achieved “widespread adoption into routine Australian practice” being used in “all geographical areas of Australia, and in all geological environments that include recent to ancient alluvial soils, and residual soils derived from both sedimentary and crystalline rocks”.
Unsurprisingly, the results of these and similar findings have led to fewer and fewer Atterberg tests being undertaken, and more and more shrink swell tests being undertaken. The conclusions of Fityus et al. (2005) must be considered in full:
“The shrink swell test is a simple and economical test that is performed on undisturbed clay soil samples to yield a reactivity index that enables free surface ground movements to be predicted. It has been employed in routine geotechnical practice in Australia for the past 20 years, and during that period, it is considered to have served the Australian geotechnical industry well. The successful, widespread adoption into Australian industry practice is due to several factors.
Firstly, it has a rational and intuitive basis, making it attractive to practicing and geotechnical engineers. In particular, the test evaluates the soil over the full range of volume change, not just the swell or the shrinkage phase, thereby making the method independent of the initial moisture state of the soil.
Secondly, it involves a simple and economical laboratory test that can be performed on a routine basis, without adding excessively to the cost of light residential construction.
The inherent simplicity of the shrink swell test derives from several simplifying assumptions that effectively avoid the physical measurement of soil suction. On the basis of available research, and a quantitative assessment of the successful employment of the shrink swell test in routine practice, the error introduced by these assumptions is considered to be acceptably small.”
In the opinion of Fityus et al (2005), the “design of foundations, guided by the results of shrink swell testing, is successful in the vast majority of cases, considered in the context of both achieving adequacy in design, and avoiding significant over design”. Indeed, a key appeal of the test is that, with AS 2870:2011, there is an off-the-shelf foundation design solution for any particular site soil class.
As noted by Fityus et al. (2005), “despite its relative successful adoption in Australia over the past 20 years or so, its existence and use within Australia are not widely known by the international community. The method employed in Australia has never been described in international literature.”
The stated purpose of that paper was to “raise the international awareness of the method of assessing expansive soils that is broad enough in its scope to be able to be applied successfully and in a general way, to soil conditions as widely varying as those found in Australia.”
Based on the strength of those authors’ claims concerning the reliability of the shrink swell test, together with studies by Brown et al (2008) that supported its suitability for a range of Auckland soils, the Australian approach to shrink swell testing and foundation design based on the simplified shrink swell index was adopted in New Zealand.
By 2011 the shrink swell test (AS 1289.7.1.1 2003) and the slab and footing design approach (AS 2870:2011) had become codified into required geotechnical practice in New Zealand, mandated within the New Zealand Building Code and the New Zealand Standard for the design of lightweight timber-framed buildings (NZS 3604:2011), and Codes of Practice for Land Development and Subdivision.
Because AS 2870:2011 also applies to masonry buildings, building designers in New Zealand have also adopted the standard foundation solutions in AS 2870:2011 for those
as well.
Auckland, like many of the cities in Australia, is underlain by expansive soils. The mandated requirement for shrink swell testing has resulted in a substantial dataset of shrink swell test results. The adoption of the shrink swell index has also resulted in many hundreds of residential building foundations being designed on the basis of the site soil class.
The fundamental basis for adopting the shrink swell test is that the “the test evaluates the soil over the full range of volume change, not just the swell or the shrinkage phase, thereby making the method independent of the initial moisture state of the soil” (Fityus et al (2005), emphasis added).
However, other expansive soils experts and researchers in Australia began to question the efficacy of the shrink swell test, and a recent paper (Hargreaves, 2017) has suggested that the shrink swell test has an initial moisture content bias. Hargreaves first raised these concerns in 2008. If the test is unreliable in Australia, then could it also be unreliable in
New Zealand?
V. A critical examination of the suitability of the shrink swell index
Shrink swell data from a site in Auckland was critically analysed. Soil mapping of the site in 2004 indicated that the same montmorillonite clay-rich geology was present across almost the entire site.
These soils are characterised by their expansiveness and their instability at only moderate slope angles. Soil creep is also a common process, confirming the shrink swell behavior of the soils
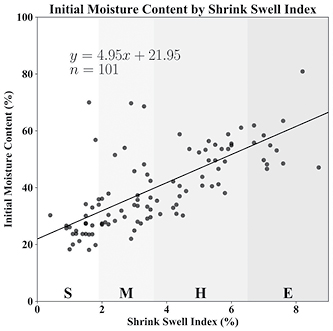
Plotting the initial moisture content against the shrink swell index clearly indicates that the principal variation in the shrink swell index can be determined from the initial moisture content.
The wetter the soil, the higher the shrink swell index. Figure 1 shows plots of the shrink swell test data for the Auckland 1 site.
The implications are significant. Essentially the same soil, the test results span across a wide range of index values.
Figure 1: Plot of the shrink swell index against initial moisture content for the Auckland 1 site
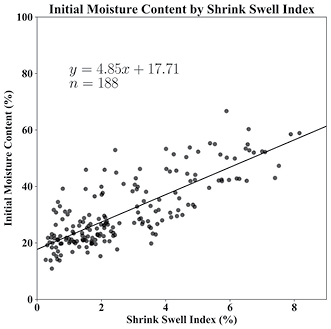
Analysis of other shrink swell datasets from a wide range of soils across other Auckland sites shows similar trends. An amalgamation of test results from four sites in the Auckland metropolis is shown in figure 2.
Figure 2: Plot of the shrink swell index against initial moisture content for several Auckland metropolis sites with soils derived from sedimentary rock, Quaternary alluvium and volcanic ash
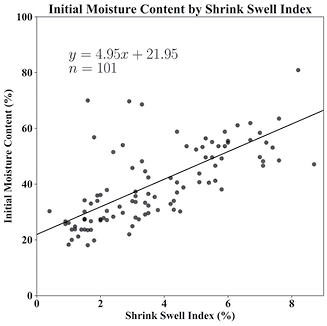
Although less apparent than for the Auckland North 1 site, the Auckland metropolis test data also clearly shows the same trend: the higher the water content, the higher the shrink swell index.
To investigate this issue even further, shrink swell tests from an Auckland site with similar soils were analysed. These soils are mainly derived from Quaternary alluvium and soft Tertiary age sedimentary rocks of the East Coast Bays Formation.
The aggregated results for the entire Auckland 3 site are shown in figure 3.
Figure 3: Plot of the shrink swell index against initial moisture content for the Auckland 3 site
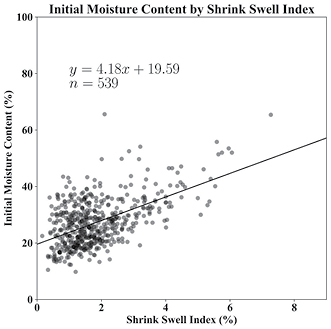
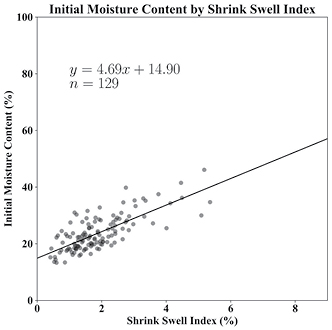
Again, in general the wetter the soils the higher the shrink swell index. This site is divided into a number of blocks, and data for the larger individual blocks are shown in figures 4 to 7.
Clearly these results are not those which would be expected from a test that purportedly removes the initial moisture content bias.
An initial thought was that New Zealand soils might be very different from Australian soils, not because of clay mineralogy, but because of their time, depositional and stress history. Droughts are rare in New Zealand but common in Australia.
In 2005, as a dissertation towards a BE degree, David Earl submitted his research into correlations between the shrink swell index and Atterberg limits for soils within the Shepparton Formation, from sites in the Upper Murray Basin in Victoria, Australia.
Examination of Earl’s dataset of shrink swell test results for 29 Australian soil samples of the same soil (Quaternary alluvium) shows a similar trend, as shown in figure 8.
Other published results from studies of the shrink swell index of Australian soils have shown similar trends. Li et al. (2016) plotted shrink swell indices against both initial and final water content for a wide variety of metropolitan sites in Melbourne, as recreated figure 9.
Figure 4: Plot of the shrink swell index against initial moisture content for the Auckland 3 site, Block A

Figure 5: Plot of the shrink swell index against initial moisture content for the Auckland 3 site, Block B
Figure 6: Plot of the shrink swell index against initial moisture content for the Auckland 3 site, Block C

Figure 7: Plot of the shrink swell index against initial moisture content for the Auckland 3 site, Block D
Shrink swell test data for a range variety of sites in New South Wales and Queensland as shown in Figure 10.
The moisture content data for the Li et al. (2016) dataset were obtained graphically. It shows a similar trend to the Auckland 1, Auckland 3 and Auckland metropolis sites and Upper Murray Basin site.
Figure 8: Plot of the shrink swell index against initial moisture content for the Upper Murray Basin, Victoria site

Figure 9: Plot of the shrink swell index against initial moisture content for several metropolitan Melbourne sites

Li et al. (2016) made a comment in the abstract that “the study indicated that there is a significant variation in results across any particular soil type and that a blanket estimated value based on that soil type may not be entirely appropriate”.
This key observation was not, however, repeated within the body of the paper nor was it included as a conclusion.
Earlier work by Zou (2015) on the same data used by Li et al. (2016) provided the individual shrink strain and swell strain components for the 60 shrink swell tests in the amalgamated Melbourne metropolis dataset used in
this paper.
Figure 10: Plot of the shrink swell index against initial moisture content for several sites in New South Wales (NSW) and Queensland (QLD).

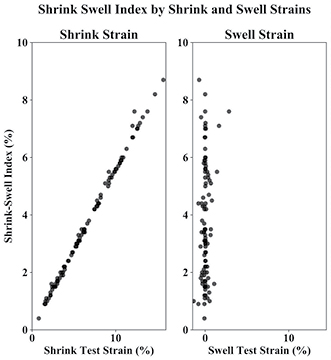
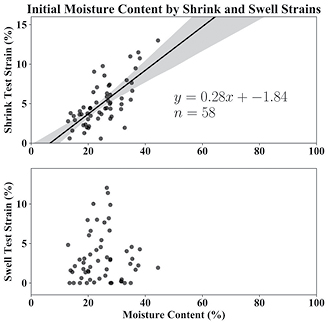
To gain a better understanding of the shrink swell test results, the individual strains were plotted against the shrink swell index for each test. The results for the Auckland 1 site (188 test results of the same essentially the same soil) are shown in figure 11. This figure clearly demonstrates that the shrink swell index value for the Auckland 1 site is being driven by a shrink strain bias, not a swell strain bias.
The average shrink test strain is about 4.75%, whereas the average swell test strain is only about 0.21%. Based on the formula for the shrink swell index, it is clear how the shrink test strains, being about 20 times greater than the swell test strains, would dominate.
Evidently, the swell test strains contribute very little to the resulting shrink swell index value. The simplified shrink swell index is based on the assumption that there is a swell strain bias, and hence the swell test result needs to be divided by 2. This assumption is undermined by the analysis of our datasets.
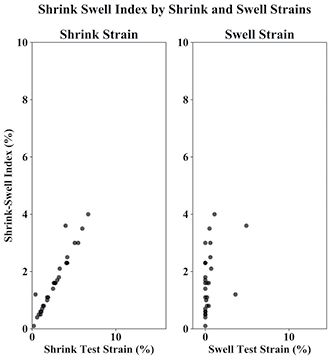
The individual strains for the Auckland metropolis sites are shown on figure 12, and the individual strains for the aggregated Auckland 3 site are shown in figure 13.
Figure 11: Plot of shrink test strains (left) and swell test strains (right) against the shrink swell index for the Auckland 1 site
Figure 12: Plot of shrink test strains (left) and swell test strains (right) against the shrink swell index for the Auckland metropolis site

The Australian data sets are shown in Figures 14 to 16.
Figure 13: Plot of shrink test strains (left) and swell test strains (right) against the shrink swell index for the Auckland 3 site
Figure 14: Plot of shrink test strains (left) and swell test strains (right) against the shrink swell index for the Murray Basin site
Figure 15: Plot of shrink test strains (left) and swell test strains (right) against the shrink swell index for the Melbourne metropolis sites
Figure 16: Plot of shrink test strains (left) and swell test strains (right) against the shrink swell index for the NSW and QLD sites


These datasets clearly show an overwhelming shrink strain bias, in both the New Zealand and the Australian soils analysed. It is therefore important to go back and revisit the data that Fityus (1996) based his conclusions on, and which ultimately formed the basis for the acceptance of the ISS test and AS2870 into the New Zealand codes
of practice.
Fityus (1996) has data plots (figures 17 and 18) showing the swell strains clearly decreasing with increasing moisture content, and the shrink strains doing the reverse; increasing with increasing moisture content. These data plots have been recreated by digitizing the plots in the paper, not from the raw data.
However, these are shown to illustrate what would be expected for other datasets assuming the validity of the shrink swell test if it held true for other soils in
other climates.
The data sets analyses in this study were then compared to the original plots by Fityus (1996) to see if those plots of shrink strain and swell strain versus initial moisture content could be reproduced for the sites and soil analysed in New Zealand and elsewhere in Australia.
When the initial moisture content is plotted against the respective strains individually, as in figure 19 for the Auckland 1 site, we see that there is a fairly positive correlation between the shrink test strain and the moisture content, which is what we would expect. However, for the swell test strain there is essentially no correlation at all.
Figure 17: Plots of shrink test strain (upper) and swell test strain (lower) against initial moisture content for the idealized soil dataset
Fityus 1996)
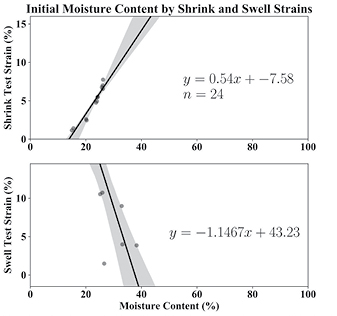
Figure 18: Plots of shrink test strain (upper) and swell test strain (lower) against initial moisture content for the Maryland dataset (Fityus 1996)
Figure 19: Plots of shrink test strain (upper) and swell test strain (lower) against initial moisture content for the Auckland 1 site

These findings raise two issues. Firstly, the relative sizes of swell and shrink strains are not comparable, so the ISS formula is disproportionally influenced by the shrink test strain.
Secondly, the swell test does not seem to be at all correlated to the sample’s initial moisture content, so combining the shrink and swell strains in a manner independent of moisture content does not seem possible in the first place.
Since the shrink test strain is defined as,
![]()
it follows that the shrink test result is basically determined solely by the initial and final sample lengths. This is shown in figure 20.
Figure 20: Plot of final (dry) length against initial (wet) length for the shrink strain test data for the Auckland 1 site

The diagonal black line is the line, Lwet =Ldry line, so we can interpret the plot in the following way: points are initially on the black line, and then after the drying during the shrink test, the points move vertically downwards to the plotted location.
The larger the movement, the larger the shrink strain, and hence too the shrink swell index. The lighter shading corresponds to the initial moisture content, and as expected, the samples with high moisture contents are able to shrink to a greater degree (so they are further from the black line).
Figure 21: Plots of shrink test strain (upper) and swell test strain (lower) against initial moisture content, for the Auckland metropolis sites

Figure 22: Shrink and swell strains plotted against initial moisture content for the Auckland 3 site
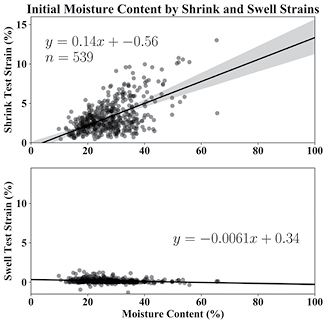
Other shrink strain and swell strain versus initial moisture content plots for the other Auckland sites are shown in figures 21 and 22.
The shrink strain and swell strain versus initial moisture plots for other Australian sites are shown in figures 23 to 25.
Plotting data from sites in Auckland, Victoria, New South Wales and Queensland have been unable to replicate the plots presented in Fityus (1996).
These figures show the general lack of correlation of greater swelling with increased moisture content. These latter results are perhaps not as surprising as in other datasets since the data is amalgamated from tests conducted of many different soil types and, in figure 25, widespread geographic areas as well.
The large magnitudes of swell strain in the Melbourne metropolis dataset certainly better support the shrink swell index formula, but the influence of the initial moisture content is still evident due to the lack of any correlation between moisture content and the swell strain (figure 24).
Figure 23: Plots of shrink test strain (upper) and swell test strain (lower) against initial moisture content for the Murray Basin site
Figure 24: Plots of shrink test strain (upper) and swell test strain (lower) against initial moisture content for the Melbourne metropolis sites

The results further reinforce the findings presented in this paper and confirms the shrink swell index has both a shrink strain and initial moisture content bias.
The overall pattern is remarkably consistent across all datasets, encompassing over 1000 shrink swell tests from 3 sites in Auckland, 2 sites in Victoria and numerous sites in New South Wales and Queensland. The swell test has almost no influence on the shrink swell index. The shrink swell index is dominated by the shrink test which has a marked initial moisture content bias.
Figure 25: Plots of shrink test strain (upper) and swell test strain (lower) against initial moisture content for the New South Wales and Queensland sites

Figure 26: Plot of the shrink swell index against initial moisture content for the Auckland 1 site
These findings have important implications for current foundation designs on expansive soils in New Zealand, and most likely for Australia as well.
Given the importance of the shrink swell test in foundation design, it is surprising that there is such a paucity of critical analyses of Australian shrink swell test data sets, and an almost complete absence of any concerns around the shrink swell test.
A notable exception is a paper by Hargreaves (2017) who concluded, based on the data analysis, that “whilst not conclusive, there is a strong trend towards higher shrink/swell values being derived from wetter initial soil moisture values.”
Hargreaves (2017) also reported that, “whilst many Australian consultants believe that the shrink/swell test has served them, and the Australian Geotechnical community well over the last 20 years, these consultants have never been faced with the situation where they have carried out a test on essentially dry samples, derived their value, only to be confronted years later with a distressed/cracked dwelling and an investigating engineer who has tested an essentially wet sample, and derived a ys value between 30% and 40% higher than the original test and then lays a claim of “under classification” by the original consultant, which is difficult and sometimes impossible to defend in court.”
The shrink swell test results from 188 tests of the same soil at the Auckland 1 site have been overlain with the
site soil classes for a 500 year return period drought in figure 26.
Figure 26: Plot of the shrink swell index against initial moisture content for the Auckland 1 site
This clearly demonstrates the dilemma articulated by Hargreaves (2017). If the soil is relatively dry, then it will produce a lower shrink swell index than when it is wet. This difference might merely reflect the day the soil
was sampled.
VI. Conclusion
Analysis of the soils tested suggests that for the datasets examined there are most likely no significant differences in the soils or fundamental soil which would account for a wide scatter of shrink swell index values in our test data sets.
It appears that the wide range of the shrink swell test results mostly reflect the initial moisture content of the soils. The wet soils have shrunk upon drying, but the dry soils have not swelled upon wetting to anything like the same extent.
Only the Melbourne metropolis datasets and that of Fityus (1996) show appreciable swelling. The shrink swell test was developed specifically to remove the initial moisture content bias, but the Auckland soils, in particular, are being dominated by the initial moisture content and the core shrinkage.
The soils that were tested by Fityus (1996) and Cameron (1989), and which formed the basis of the shrink swell index, evidently had very high swell potential, so much so that the very design of the shrink swell index seeks to take out the swell test strain bias by dividing the swell test strain by 2.
The two outlier test results of the Upper Murray Basin dataset (figure 14) also had high swell potential, where the initial moisture content was only 8% and the final moisture content almost 25%. That sample had a swell test strain bias of 9 times the shrink test strain.
The Melbourne metropolis dataset also shows considerable swell test strains, but not enough to warrant a factor of 2. Rather than confirming a swell strain bias of 2, analysis of the Auckland datasets clearly shows the bias is the other way, with an average shrink test strain bias of some 20 to 200 times the swell strain.
The results of the analysis outlined in this paper show that, as currently formulated, the shrink swell test and the shrink swell index are not suitable as the sole basis for determining foundation design on expansive soils
in Auckland.
Based on the analysis of more than 1000 shrink swell tests undertaken in New Zealand and Australia, it is clear that the simplified shrink swell test does not remove the core shrinkage test initial moisture content bias. Wetter soils are therefore likely to have much higher shrink swell indices than drier soils.
In Auckland, and also in some areas of Victoria (especially upper Murray Basin) the swell test strains are contributing little, if anything, to the shrink swell index. Most soils have a very strong shrink strain bias, and not the swell strain bias that the ISS formula envisages. Moreover, even in the Melbourne metropolis dataset where there was little, if any, shrink strain bias, there was still a very strong initial moisture content bias, even across a wide variety of soil types.
The findings of Hargreaves (2017) also suggest that the shrink strain bias of the shrink swell test might be a lot more prevalent in Australian soils than has been reported to date. The implications for the geotechnical consulting community, as well articulated by Hargreaves, are concerning.
For soils that have been assigned a high expansive soil classification (H or E), then these are most likely representative and accurately reflect the soil’s relative expansiveness. However, where soils have been assigned a site class of S or M based on a shrink swell test (ISS) result alone, this soil could, in fact, be more expansive. This could possibly have been identified if the LL and LS testing had been done first.

Given the initial moisture content influence on the shrink swell index, it is not surprising that no clear correlations have been found between the shrink swell index and Atterberg tests that better reflect the behavior of the soil, such as liquid limit, plastic limit and linear shrinkage. The shrink swell index has both initial moisture content and shrink strain biases.
The widespread abandonment of these methods has been on the basis that the shrink swell result must be more reliable, but based on our analysis of the available datasets, this does not appear to be correct in general.
Accordingly, further research is warranted to find a more reliable method of identifying expansive soils. Hargreaves (2017) recommended that “there is enough evidence around Australia for consultants to stop relying on the shrink/swell test, however as it is embedded into various standards and legislation this will not happen overnight, if ever.”
The results of this study present compelling evidence that in New Zealand consultants should also stop relying on the shrink swell test. The test is critically flawed.
Of the 25 houses damaged in Auckland and reported by Wesseldine (1980), 22 (88%) of the soils beneath the damaged houses had a LL greater than 55 and a PI greater than 30. Atterberg tests therefore present an avenue worth exploring further.
Consideration could be given to the approach adopted by the UK NHBC, which takes into account the fines fraction and the Plasticity Index, to derive a volume change potential (VCP). This approach is supported by a database of over 11000 test results. Climatic conditions in New Zealand are much more similar to the UK than
to Australia.
This approach is also supported by research undertaken by Smith (2017), which considered the clay fraction and not just the fines fraction in association with Atterberg test data.
Acknowledgment
The study would not have been possible without the support of Tonkin + Taylor and its wholly owned soil testing laboratory Geotechnics. Bruce Hargreaves and Dominic Lopes provided valuable commentary and their assistance is gratefully acknowledged.
References
Brown, B.J., Shorten, J.P.M., Dravitzki, D.N.R., Goldsmith P.R. (2008) Soil Expansivity in the Auckland Region. BRANZ Report Number 120A. ISSN: 1178-493
Cameron, .A. (1989) “Tests for Reactivity and Prediction of Ground Movement” Civil Engineering Transactions, I.E Aust., Volume 3 1989
Earl, D. (2005) To determine if there is a correlation between the shrink swell index and Atterberg limits for soils within the Shepparton Formation. A dissertation submitted towards the degree of
Bachelor of Civil Engineering, University of Southern Queensland, October 2005.
Fityus, S.G. (1996). The Effect of Initial Moisture Content and Remoulding on the Shrink Swell Index, Proceedings of the 7th Australian –
New Zealand
Fityus, SG; Cameron, DA and Walsh, PF (2005). The Shrink Swell Test. Geotechnical Testing Journal, Vol. 28, No 1
Hargreaves, B. (2017). Understanding the Shrink/Swell (Iss) test and Quantifying Ground Movements in Reactive/Expansive Clays due to Soil Moisture variations.PanPac, Dallas, USA. 2017
Li.J, Zou, J, Bayetto,P and Barker,N (2016) Shrink-Swell Index Database for Melbourne even plotted shrink swell indices against both initial and final water content. Australian Geomechanics Volume 51: No 3 September 2016
Smith, T.W. (2018). A correlation for the Shrink Swell Index, Conference on Geomechanics,, Institute of Engineers Australia, Adelaide, pp 388-393.
Wesseldine, M (1980). House Foundation Damage Caused By Shrinkable Clays. Presented to the Auckland Branch, NZIE, 13 November 1980
Zou, J (2015). Assessment of the reactivity of expansive soil in Melbourne Metropolitan area. School of Civil Environmental and Chemical Engineering, RMIT University, August 2015.B. Smith, “An approach to graphs of linear forms (Unpublished work style),” unpublished.