
Seismic Response and Soil-Pile Interaction Analyses for a Proposed Wharf Structure at the Lyttelton Port of Christchurch
Abstract
A proposed expansion at the Lyttelton Port of Christchurch in New Zealand consists of the reclamation of approximately 34 hectares of new land and the construction of a new wharf supported on piles. Seismic response of the reclamation and soil-pile interaction have been key considerations throughout the development of the conceptual and the detailed design due to the close proximity of the project site to a number of active seismic source zones. The proposed wharf structure will be supported on 1.0 m to 1.5 m diameter steel pipe piles driven through the reclamation soils and the underlying natural soil deposits.
To address the above geotechnical seismic design considerations, one-dimensional (1D) equivalent-linear and nonlinear soil amplification (site response) analyses were performed using SHAKE2000 and D-MOD2000. This was followed by two-dimensional (2D) finite difference analyses using FLAC. The 1D analyses results were used as a benchmark for calibration of the 2D models. The results of the 2D analyses were used to assess the seismic deformations of the proposed reclamation and the seismic demand on the pile-supported wharf structure. This paper discusses aspects of input motion selection for the above analyses, and deconvolution and scaling of earthquake records. Shear strain and peak ground acceleration profiles obtained from the benchmark 1D analyses are compared to those from the 2D analyses. Computed deformations of the reclamation soils and the seismic demands (moments, shear forces and deformations) on the piles are also presented.
1. INTRODUCTION
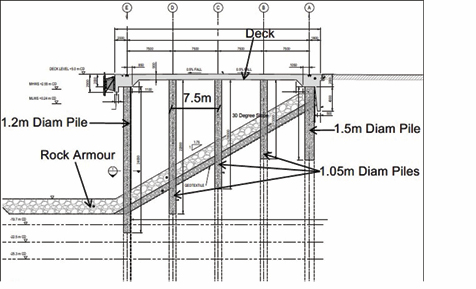
Lyttelton Port of Christchurch (LPC) is expanding the existing port at Te Awaparahi Bay. The expansion will include 34 hectares of new land including a new pile-supported wharf. To date, approximately 10 hectares have been reclaimed with the remaining reclamation to be completed in two stages. The rubble from Christchurch earthquakes was used to construct the existing reclamation. The new reclamation material will most likely be sourced from the nearby LPC owned quarry. Figure 1 shows the proposed reclamations and wharf at the port. The first stage will include the construction of a 350 m long traditional wharf with revetment, at a later time, supported on 1.0 m to 1.5 m diameter piles driven to about 100 m depth. Figure 2 is a cross-section through the reclamation at the wharf. Coffey Services (NZ) Limited (Coffey) has been involved in the project in a specialist geotechnical consulting role since early 2008. In 2014 Coffey was commissioned to provide a concept design (Antonopoulos, etc. 2017). In 2017 Coffey was engaged to carry out the detailed Stage 1 geotechnical design of the land reclamation, and seismic soil-structure interaction for the wharf piles.
Figure 1: Layout of the reclamation stages and proposed wharves at the Lyttleton Port of Christchurch
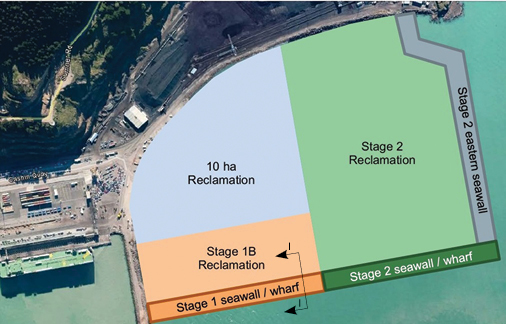
Figure 2: Cross-section through the reclamation at the location of the wharf and concept details of the future works
Seismic response of the reclamation and soil-pile interaction have been key considerations throughout the development of the conceptual design due to the close proximity of the project site to a number of active seismic source zones. For the detailed design phase, 1D benchmark soil amplification and 2D soil-foundation-structure-interaction (SFSI) analyses were performed to assess the reclamation deformations and wharf seismic performance. This paper discusses the approach followed, and the results of the seismic assessment as follows:
- Input motions from different seismic sources in consideration of the tectonic and seismic settings
at the LPC; - Deconvolution and scaling of the motions to obtain rock outcrop records;
- 1D benchmark soil amplification analyses for comparison with and calibration of the 2D time-history finite difference analysis; and
- 2D time-history finite difference analyses of the reclamation and the wharf structure to obtain the seismically induced deformations and bending moments along the wharf piles.
2. GROUND CONDITIONS AND DESIGN PARAMETERS
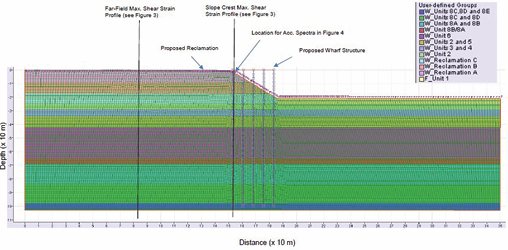
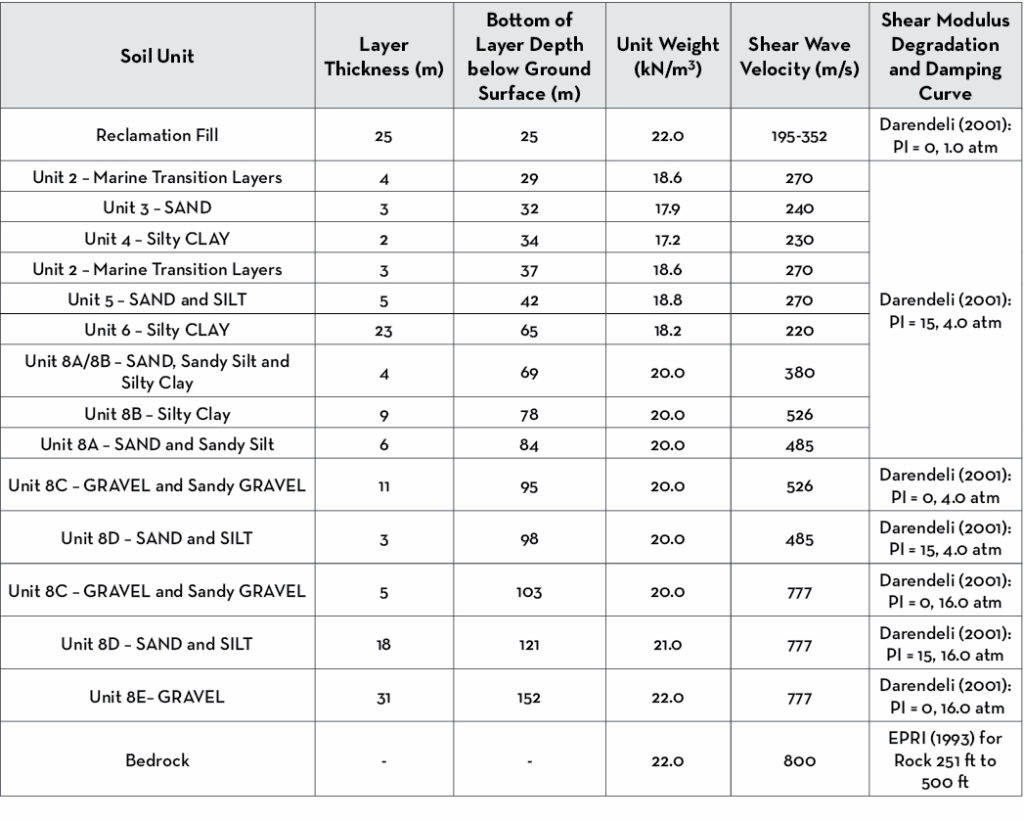
Soil conditions below the proposed reclamation generally comprise fine-grained relatively young marine sediments consisting of silt/clay and interbedded fine sand layers, underlain by weathered volcanic rock at about 150 m depth at the location of the proposed wharf. Coffey in the detailed design report (2017) presented the geotechnical model and basic geotechnical design parameters (also reproduced by Dai et al. (2018)). Figure 3 below is a simplified typical North-South section through the reclamation showing the soil units. Table 1 summarizes the relevant parameters of soil layers below the crest of the proposed Stage 1 reclamation slope considered for the 1D soil amplification analyses, as will be discussed in a later section. Soil units 2 to 6 consist of soft to firm and compact soils with shear wave velocities between 220 m/s and 270 m/s, noting that soil Unit 1 will be dredged prior to proposed Stage 1 fill placement. Soil Unit 8 consists of over-consolidated and very dense marine/colluvium deposits and talus with shear wave velocities between 380 m/s and 777 m/s.
Figure 3: 2D analysis model of the North-South cross-section through the reclamation
3. METHODOLOGY
The methodology applied to the seismic design can be outlined in Figure 4. It comprises a series of ten steps that involve selection of earthquake events, calibration of the hysteretic material models, 1D soil amplification benchmark using both the equivalent linear and nonlinear methods, 1D soil amplification using FLAC, calibration of constitutive models and boundary conditions of the FLAC model using the 1D results, and finally 2D SFSI time history analysis with FLAC and further refinement/calibration.
The pseudo-spectral acceleration (PSA) with period, maximum horizontal ground acceleration (αmax), and maximum shear strain (Vs), propagating through the soil column from the corresponding 1D analyses are compared with each other and re used as criteria for selecting the preferred constitutive model and hysteretic damping for use in FLAC 1D and 2D analyses.
Figure 4: Outline of the seismic design methodology

4. 1D BENCHMARK SOIL AMPLIFICATION ANALYSIS
4.1 Analysis Methodology
Equivalent-linear (EL) and nonlinear (NL) 1D soil amplification analyses were performed for benchmark comparison with the 2D model to be presented in a following section. The 1 analyses were performed using the software SHAKE2000 (Ordóñez, 2012). Darendeli (2001) shear modulus degradation and damping curves were used for soil units. EPRI (1993) shear modulus degradation and damping curves were used for rock (see Table 1).
Table 1: Typical soil profile below the crest of the proposed reclamation slope.
The NL analyses were performed using the software D-MOD2000 (Matasović and Ordóñez, 2011). D-MOD2000 uses the MKZ non-linear stress-strain model (Matasovic and Vucetic, 1993). The MKZ model input parameters were obtained by curve fitting to the Darendeli (2001) curves and using the Automatic Linear Data Optimization routine that is embedded in D-MOD2000. In addition to the hysteretic damping accounted for by the MKZ model, D-MOD2000 uses Rayleigh damping to account for energy dissipation at very low shear strains. Simplified Rayleigh damping was used with target damping ratios of 1% and 2% (Matasović and Ordóñez, 2011). D-MOD2000 analyses performed using damping ratio of 1% resulted in unrealistically high maximum accelerations (>10 g) at few depths and the program prompted an error message, a likely indication of numerical instability. These errors were not encountered for the analyses performed using damping ratio of 2%, and therefore, damping ratio of 2% was used in the NL model.
4.2 Input Motions
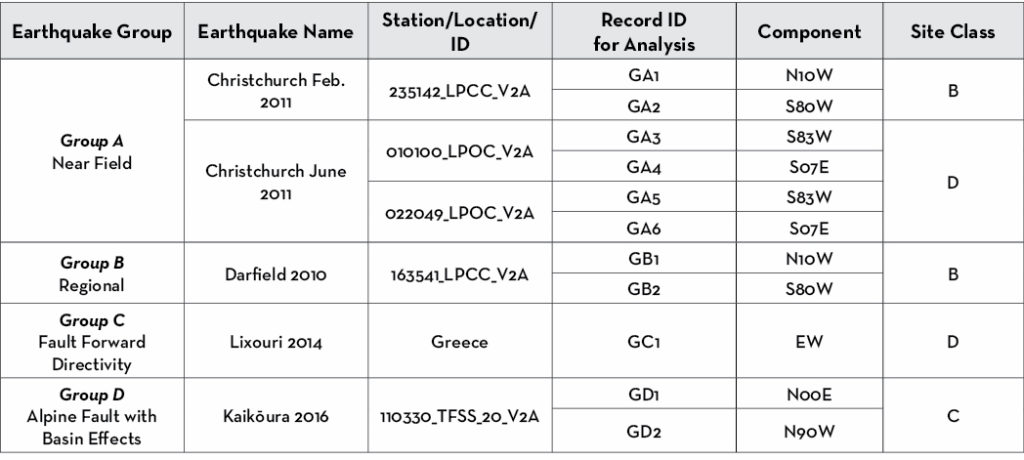
Four types of earthquake events were considered for the analysis as shown in Table 2: near-field, regional, fault forward directivity, and Alpine Fault with basin effects. Deconvolution was performed to obtain firm ground, defined as Site Class B, rock outcrop motions as input for the soil amplification analysis model. Details related to processing the input motions are as follows:
- The Christchurch February 2011 and the Darfield 2010 Site Class B (Rock) records were used as rock outcrop motions (i.e., without deconvolution)
- The Christchurch June 2011 time histories used were recorded on a reclamation site approximately 2.5 km west of the proposed Te Awaparahi Bay Stage 1 reclamation. Deconvolution of these records was performed to obtain the corresponding rock outcrop motions, which were used then used as input for this analysis at bedrock;
- The Lixouri 2014 record was recorded at soil surface for a Site Class D soil profile. The deconvolved record at the base of the soil column was used as input motion for the analyses;
- The Kaikōura 2016 TFSS records were recorded on an old reclamation at the Port of Wellington. Deconvolution was performed based on soil profile and properties interpreted according to Cubrinovski et al. (2017). Anticipated soil conditions consist of reclamation fill, underlain by less than 4 m of marine sediments, underlain by very dense/stiff (SPT N > 50 blows/ft) Wellington Alluvium, which was taken as the bottom layer for deconvolution soil column. The depth to bedrock at the Port is not known but is likely more than 200 m. In consideration of the similarity in interpreted shear wave velocity of the Wellington Alluvium and the LPC Unit 8B – Silty Clay, the deconvolved Kaikōura 2016 records were later used for LPC 1D response analysis as input motions at the top of Unit 8B – Silty Clay.
The rock outcrop motions, except for Group D, were linearly scaled to the Class B 475-year peak ground acceleration (PGA) of 0.56g based on the GNS 2015 report “Seismic hazard assessment of Lyttelton Port incorporating additional site classes” (GNS, 2015). As discussed above, the Kaikōura 2016 (Group D) records were used as input motions at the Unit 8B – Silty Clay. The input records were scaled to a horizontal acceleration of αh=0.43g which corresponds to average peak horizontal acceleration of the records for the other groups, calculated at the top of Unit 8B.
Table 2: Earthquake input records.
4.3 1D Analysis Results
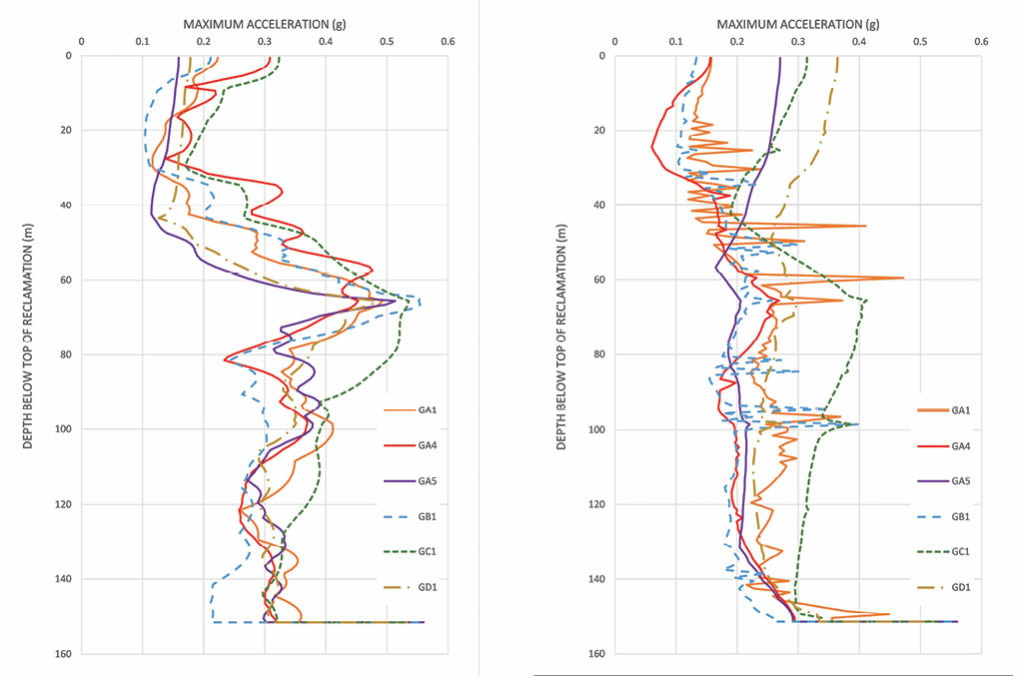
Maximum shear strain and horizontal acceleration profiles from SHAKE2000 and D-MOD2000 are shown in Figures 5 and 6 respectively, for the most critical records (GA1, GA4, GA5, GB1, GC1 and GD1) with the highest peak accelerations and shear strain responses for their respective earthquake groups. Maximum shear strains were very similar for both EL and NL analyses. The highest shear strains (up to 2%) are within soil Unit 6 (silty clay) with relatively low shear wave velocity of 220 m/s. The αmax values at ground surface obtained from NL analyses ranged from 0.13g to 0.37g compared to 0.16g to 0.33g for EL analyses. The Lixouri 2014 (GC1) and Kaikōura 2016 (GD1) records resulted in the highest surface αmax. Overall, the results indicate de-amplification of the bedrock outcrop input motions.
Figure 5: Maximum shear strain, (γs), profiles from SHAKE2000 (Left) and D-MOD2000 (Right)
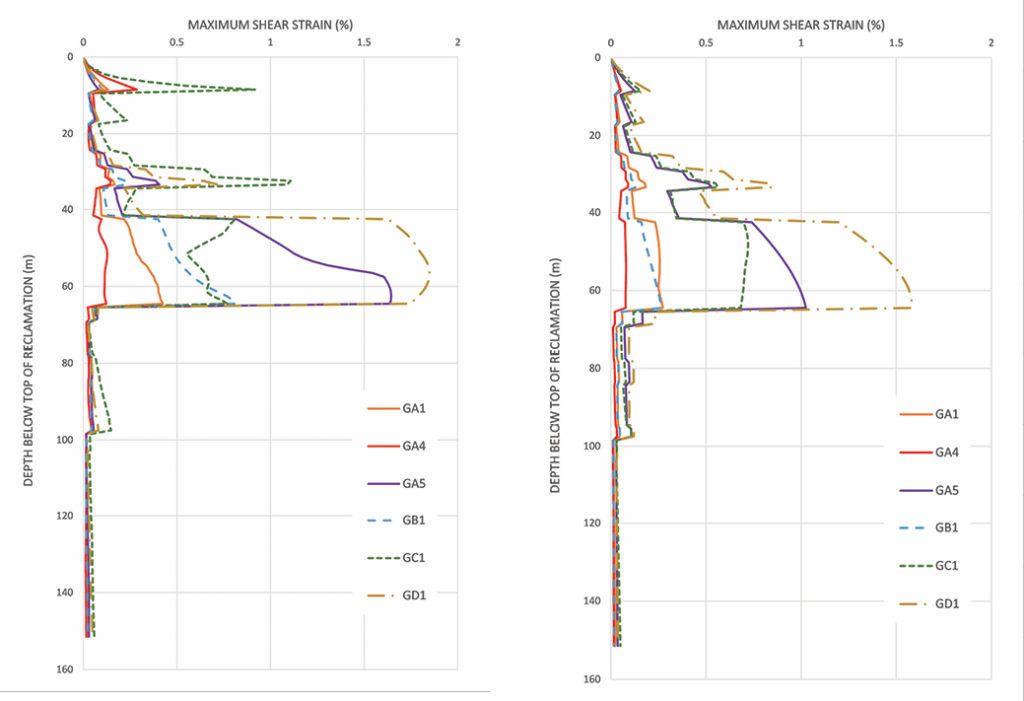
Figure 6: Peak horizontal ground acceleration, αmax, profiles from SHAKE2000 (Left) and D-MOD2000 (Right)
5. 2D TIME-HISTORY SEISMIC ANALYSIS
5.1 Analysis Methodology
Dynamic time-history analyses were performed using the finite difference software FLAC (version 7.0, Itasca). The model captures the interaction between the wharf and the soil. A north-south cross-section shown in Figure 3 was considered. Soil stratigraphy was simplified by considering horizontal layers and by modeling soil layers with similar shear wave velocities as single layers. To reduce computational time, the FLAC model was truncated within soil Unit 8 with shear wave velocity of 777 m/s. This is not expected to impact the results due to the high shear wave velocity that is similar bedrock (800 m/s). Details of the FLAC modelling are as follows:
- The Mohr-Coulomb constitutive model was used for the soil units to simulate the shear strength (excess pore water pressure generation was not explicitly modelled);
- Hysteretic damping for all soil elements was applied and was primarily captured using the FLAC sigmoidal model, sig4. The selected sig4 model parameters were obtained from FLAC dynamic manual based on a numerical fit to the upper range Seed and Idriss (1970) for sand and upper range Sun et al. (1988) for clay;
- For the analyses carried out, a Rayleigh damping in FLAC with εmin of 2.2% at frequency fmin of 3.0 Hz was applied to all soil elements, which resulted in a close match between FLAC and 1D benchmark analysis results. Sensitivity analyses were also performed to assess the impact of Rayleigh damping by conservatively not including Rayleigh damping. The deformations and moments for the case without Rayleigh damping were higher than the base analysis case (i.e., with Rayleigh damping);
- Coupled fluid-mechanical effective stress analyses were performed;
- 1D FLAC analysis was also performed for comparison with the benchmark SHAKE2000 and D-MOD2000 analyses discussed in the previous section; and
- The most critical earthquake records were found to be the Kaikōura 2016 and the Lixouri 2014. They both exhibit similar acceleration, shear strain, and spectral acceleration results, however, the Kaikōura 2016 event is over 60s long whereas the Lixouri 2014 lasts for only 20s. The characteristics and especially the duration of the latter was a primary criterion for selecting it to proceed with the final 2D SFSI analyses, and its results are presented below.
5.2 FLAC Analysis Results
FLAC large strain deformations and horizontal displacements are shown in Figure 7. Figure 8 shows the maximum shear strain profiles obtained from SHAKE2000, D-DMOD2000, FLAC 1D and 2D analyses. A reasonable match is noted for depths below approximately 30 m. Shear strains obtained from the FLAC 2D analyses (slope crest section) for depths shallower than approximately
30 m correspond to the reclamation slope deformations.
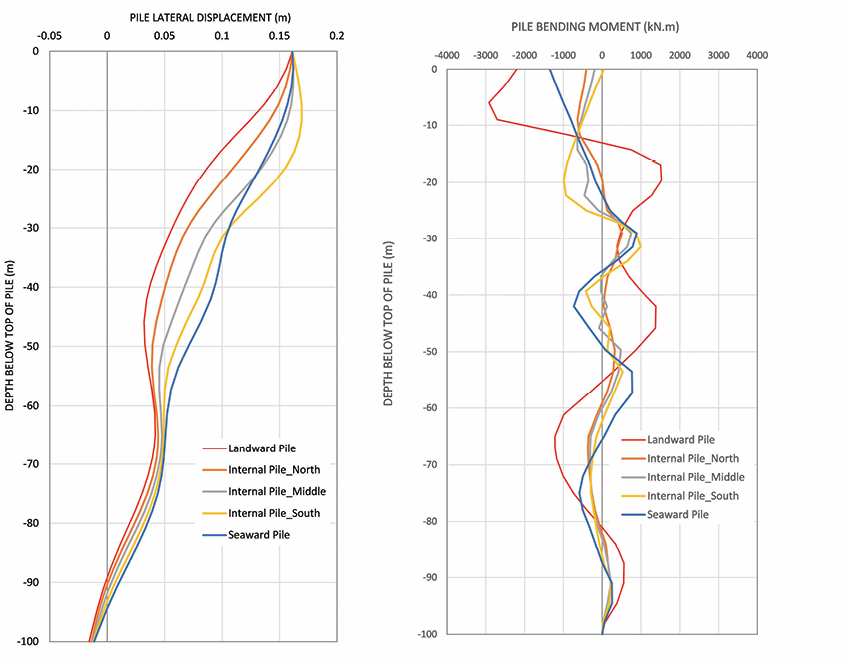
Computed lateral deformations and bending moments for the wharf piles are presented in Figure 9. Pile head deformation of about 160 mm were computed. The highest bending moments are for the landward pile with the largest diameter of 1.5 m.
Figure 7: FLAC 2D large strain deformations and horizontal displacements (in m)
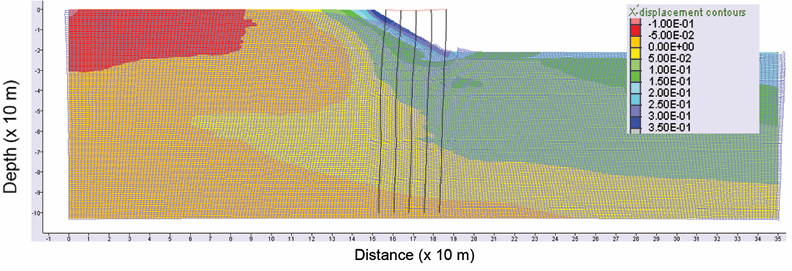
Figure 8: Maximum shear strain, (Ys), profiles from FLAC 1D and 2D analyses
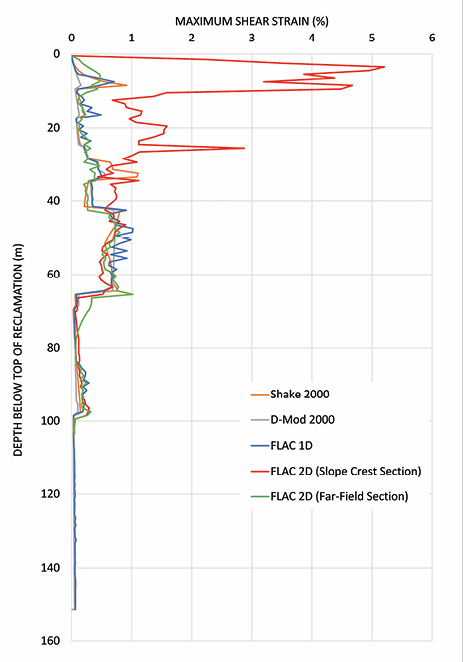
Figure 9: Horizontal (lateral) displacements (left), and bending moments of the Wharf piles from FLAC 2D analyses (right)
6. CONCLUSIONS
1D and 2D soil amplification analyses were performed for the proposed reclamation and wharf at LPC to assess the seismically-induced deformations of the reclamation and seismic demands on the wharf piles. The 1D soil amplification analyses were undertaken using SHAKE2000 (equivalent linear) and D-MOD2000 (nonlinear). The 2D seismic analyses that incorporate the wharf structure were performed using FLAC.
Near-field, regional, fault forward directivity, and Alpine Fault with basin effects earthquake records were selected as excitation for the above modelling. Deconvolution was performed to obtain the bedrock outcrop motions to use as input for all the analysis.
The results of the 1D analyses indicate de-amplification of the rock outcrop accelerations. The far-field (i.e., away from the slope crest) FLAC 2D maximum shear strains are very similar to those from SHAKE2000 and D-MOD2000. The noted close agreement between the 1D and 2D results indicate the adequacy of the modelling approach followed.
Shear strains near the slope crest obtained from FLAC 2D for depths shallower than approximately 30 m were higher than those from for the far-field section as they correspond to the reclamation slope deformations. Furthermore, the results showed that highest wharf pile bending moments are for the landward pile with the largest diameter of 1.5 m.
7. Acknowledgement
A number of Coffey staff have worked cooperatively on this project, contributing to the successful completion of the work, including Andrew Hutchinson and Chris Thompson. The authors are grateful to the staff who contributed to this project. The authors also wish to thank Lyttelton Port of Christchurch for their approval to publish this paper.
8. REFERENCES
- Antonopoulos I.K. & B.H. Cheah (2017). Seismic design of the Te Bay Reclamation of the Lyttelton Port of Christchurch. PBD-III Vancouver 2017.
- Coffey (2017), Design Report on LLPC Te Awaparahi Bay Stage 1 Land reclamation, 773-CHCGE208087AA, Christchurch, NZ.
- Cubrinovski, M., Bray, J., de la Torre, C., Olsen, M., Bradley, B., Chiaro, G., Stocks, E., and Wotherspoon, L. (2017). Liquefaction effects and associated damages observed at the Wellington Centreport from the 2016 Kaikōura earthquake, Bulletin of the New Zealand Society for Earthquake Engineering, Vol. 50, No. 2.
- Ordóñez, G. (2012). SHAKE2000 – A Computer Program for the 1-D Analysis of Geotechnical Earthquake Engineering Problems. Geomotions, LLC; Lacey, Washington, USA.
- Dai, C., Hutchison, H. Antonopoulos, I. and Thompson, C. (June 2018), Detailed Design of Land Reclamation over soft ground in a Seismically Active Environment at Lyttelton Port of Christchurch, New Zealand Geomechanics News.
- Darendeli, M. (2001). Development of a New Family of Normalized Modulus Reduction and Material Damping Curves. Ph.D. Dissertation. The University of Texas at Austin.
- Electric Power Research Institute. (1993). Guidelines for Determining Design Basis Ground Motions, Vol. I: Methods and Guidelines for Estimating Earthquake Ground Motion in Eastern North America. EPRI TR-102293 Project 3302, November 1993.
- Itasca (2011). FLAC v. 7: Fast Lagrangian Analysis of Continua, Version 7.0.
- Matasović, N. and Ordóñez, G. (2011). D-MOD2000 – A Computer Program for Seismic Response Analysis of Horizontally Layered Soil Deposits, Earthfill Dams and Solid Waste Landfills. Geomotions, LLC; Lacey, Washington, USA.
- Matasović, N. and Vucetic, M. (1993). Cyclic Characterization of Liquefiable Sands. ASCE Journal of Geotechnical Engineering, Vol. 119, No. 11, pp. 1805-1822.
- Sun, J. I., Golesorkhi R., and Seed, H. B. (1988). Dynamic Moduli and Damping Ratios for Cohesive Soils. Earthquake Engineering Research Center, university of California, Berkeley, Report No. UCB/EERC-88/15.
- Seed, H. B., and Idriss I. M. (1970). Soil Moduli and Damping Factors for Dynamic Response Analysis. Earthquake Engineering Research Center, university of California, Berkeley, Report No. UCB/EERC-70/10.