
ABSTRACT
Waka Kotahi, the New Zealand Transport Agency (NZTA), under its policy of providing a safer and more resilient road network, has adopted the NSW Government Transport, Roads & Maritime Services ‘Guide to Slope Risk Analysis’ to provide a consistent methodology for assessing safety to road users. The approach was first adopted for remediation of the slopes affected by the M7.8 Kaikoura Earthquake, and has subsequently been utilised on further NZTA projects.
In 2017, the NZTA included an Assessed Risk Level (ARL) of 3 or better (to be determined in accordance with the NSW Guide) as a Minimum Standard for the proposed Mt Messenger Bypass, State Highway 3, Taranaki.
This new section of road requires high cuts through soft rocks of the Mount Messenger Formation. The combination of steep natural topography and requirement to minimise the earthworks footprint in the ecologically-sensitive environment, determined the need for high, steep rock cuttings with a resulting rockfall hazard, primarily from ‘slabbing-type’ failures of the non-cemented sandstones and siltstones.
This paper presents a brief introduction to the NSW Guide procedure and the methodology adopted for determining the rockfall hazard for the Mt Messenger Bypass, including a field trial to calibrate rockfall modelling, and development of mitigation measures to achieve the required minimum ARL.
The NZTA has adopted a slightly modified version of the NSW Guide for application across its network and highlights the strict requirements around training and accreditation for NZ-based geotechnical professionals to apply the risk analysis procedure to promote accurate and consistent assessments.
Guide for Slope Risk Analysis
Background
The New South Wales Government, Transport Roads and Maritime Services ‘Guide to Slope Risk Analysis’ Version 4, April 2014 (the ‘Guide’) was developed to assess the risks associated with cut and fill slopes, natural slopes, retaining structures and spill through bridge abutments adjacent to state roads in New South Wales. It is intended to assist in setting priorities for investigation, monitoring, remediation and management of such slopes and structures. It is based on the approach presented in the Landslide Risk Management Concepts and Guidelines and the Practice Note Guidelines for Landslide Risk Management (2007).
The Guide is very clear that it is intended for use by competent geotechnical practitioners and that ‘extensive training in the use of the method is necessary before meaningful assessments can be made, even when the analyses are carried out by geotechnical practitioners experienced in slope stability assessments. Use of the procedure is therefore restricted to experienced geotechnical practitioners who are trained and accredited by RMS’.
The Guide was primarily developed for use in assessing risks to existing highway infrastructure, but is also applicable to new roads as a way of assessing the safety requirements to be instigated at the design stage.
In New Zealand, the NZTA is adopting the Guide for use on the state highway network, with some modifications to be covered in a ‘country amendment’, and will be making available the necessary training and accreditation for geotechnical practitioners as a prerequisite for its application.
Application of the Guide – determination of the Assessed Risk Level
This section provides a very brief overview of the procedure detailed in the Guide. As noted above, geotechnical practitioners are required to be familiar with the details provided in the Guide and undertake training and an assessment prior to use on RMS or NZTA projects.
The Guide follows the general process for risk management as set-out in AS/NZS 4360 (2004), in terms of establishing the context of the process, identifying and analysing the hazards with respect to likelihood and consequences. Evaluation, management, monitoring and communication of the assessed risk follows on from slope risk analysis.
For existing sites, the slope risk analysis is largely based on visual assessments, but may be supplemented by further information where available. Whilst insufficient information is typically available to complete a quantitative probabilistic analysis, the risk assessment procedure is based on an underlying quantitative structure expressed in a series of rating scales. Application of the Guide for new sections of road, requires judgement as to the expected hazards and performance of the slopes. It is anticipated that these assumptions would be validated during and following construction through a visual assessment.
The risk assessment procedure reflects conditional probabilities which characterise the chain of events which must occur for slope instability to result in a fatality. In essence, the process considers the Likelihood of a slope failure occurring and interacting with road users, combined with the Consequence of that interaction (risk to life), to determine an overall Assessed Risk Level (ARL).
Likelihood
Likelihood is assessed based on two parameters: Probability of detachment (Pd) and Travel Probability (Pt).
Probability of detachment (Pd) represents a potential slope failure mechanism, ranging from 1 (failure appears imminent or evidence the mechanism is currently active) to 1×10⁻⁵ (failure would require the most extreme of triggering events).
Having identified potential failure mechanisms, the probability of that failure interacting with road users (the ‘element at risk’) is evaluated. A travel probability (Pt) of 1 implies that the mechanics and volume of the failure make it certain that the failure will reach the element at risk, reducing to <1×10⁻⁶, where such a failure is extremely unlikely impact road users.
Both Pd and Pt are estimated based on orders of magnitude, to reflect the uncertainty in estimating accurately these parameters. The combination of Pt and Pd confirms the Likelihood (L) category from the risk matrix given in Figure 1.

Figure 1: Likelihood allocation matrix, Table 10 taken from the Guide.
The likelihood allocation ranges from L1, with an indicative annual probability of 0.9, meaning the event may, or is expected, to occur within a short period under average circumstances, or the mechanism is currently active, to L6, in which the event is unlikely to occur even under extreme circumstances.
Consequence
Once a hazard has been identified, the Consequence of the hazard is assessed. The Guide considers Consequence in terms of both loss of life and damage to property (social/economic impacts).
Note that the Guide includes failure mechanisms associated with cuttings / natural slopes, embankments and retaining walls. The application of the Guide for NZTA projects is currently limited to cuttings / natural slopes and only considers the consequence in terms of loss of life. As such, the remainder of this paper focuses on the life safety assessment. It is worth noting that the economic/social disruption impact of rockfall-type failures, which can typically be cleared very quickly and cheaply by road maintenance crews, is generally minimal. This aspect relates more to embankment / retaining wall failures where road closures may stay in place for a prolonged period and require expensive remedial works.
There are two parameters that are combined to assess the Consequence in terms of loss of life: Temporal Probability (T) and Vulnerability (V).
The temporal probability that a person will be impacted by the failure, at the time of failure; i.e. hit by falling debris, or that they may drive into debris, and their ability to evade the failure. Temporal probability ranges from T1 (probability >0.5, i.e. a person is usually expected to be present as part of the normal pattern of usage) to T5 (probability < 0.001, a person is very unlikely to be present). For road users, Temporal Probability is defined in the Guide as the traffic volume (Average Annual Daily Traffic, AADT). This is illustrated in Figure 2.
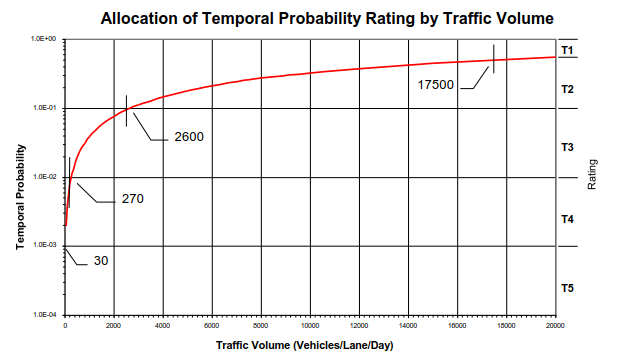
Figure 2: Temporal probability rating for road users (Figure 10 taken from the Guide).
It should be noted that for roads close to the traffic volume boundaries between ratings, the temporal probability, and therefore Consequence and assessed risk level, may change over time, even if all other factors remain equal.
Having assessed the temporal probability of possible failure mechanisms, it is then necessary to consider the Vulnerability (probability of the event causing death), from the interaction of road users with the hazard. The Vulnerability takes account of vehicle speed (post speed limit for the section of road) and block size (minimum dimension as it would lie on the road).
Ratings vary from V1, with a probability >0.5, i.e. for a vehicle impacting a large block (>1m) at highway speeds, to V5 (probability <0.001, i.e. vehicle impacting a small block (around 0.2m) at urban speeds or a smaller block at highway speeds). A series of tables and definitions are provided in the Guide to help determine the Vulnerability for different size / types of debris and travel speeds. These generally assume a vehicle impacts debris deposited on the road, rather than a direct impact by rockfalls, but a separate table is provided for the latter scenario.
A combination of the assessed Temporal Probability (T) and Vulnerability (V) results in the Consequence, as shown in Figure 3.
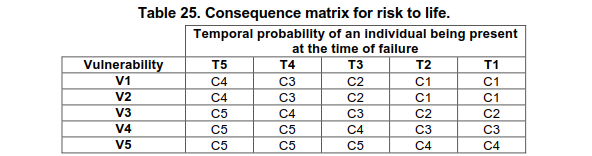
Figure 3: Consequence matrix for risk to life (Table 25 taken from the Guide).
Assessed Risk Level
Once the Likelihood and Consequence have been determined, for each hazard present at a site, the Assessed Risk Level (ARL) is determined from a risk matrix (Figure 4).

Figure 4: Assessed risk level matrix (Table 27 taken from the Guide).
The ARL for a site is confirmed as the highest (worst) for each of the assessed hazards.
Determination of the ARL is largely considered to be a rating, from which evaluation and management of the risk can be determined. Generally speaking, an ARL1 or ARL2 is likely to be considered unacceptable in the medium- to long-term, and remedial measures may be put in place to reduce the risk. Temporary measures may be employed in the short-term (i.e. speed restrictions) whilst the site is further assessed and mitigation options developed. ARL4 and ARL5 are considered acceptable (for existing sites and for new roads), but should be monitored to check for any deterioration. An ARL3 is typically considered to sit in the range where regular monitoring and/or some interception and remedial measures may be deemed appropriate for existing roads. To date, NZTA has required an ARL3 or better be adopted for existing and new sections of state highway, reflecting the generally more active and dynamic geological conditions in NZ compared to NSW.
When used as a rating, it is clear that achieving consistency of assessments over time and between assessors is critical to the aims of the risk assessment procedure. The Guide, training and accreditation, are necessary to promote this consistency amongst geotechnical practitioners undertaking slope risk analysis.
MT Messenger Bypass, State Highway 3, Taranaki
Overview
The Mt Messenger Bypass is being designed and constructed by the Mt Messenger Alliance (MMA). This comprises Downer Enterprises Ltd, HEB Construction Ltd, Tonkin & Taylor Ltd and WSP New Zealand Ltd, in association with NZTA.
The primary objectives of the bypass are to enhance the safety, resilience and journey time reliability of travel on State Highway 3 (SH3) between New Plymouth and Hamilton, contributing to enhanced local and regional economic growth and productivity for people and freight.
The project involves the construction of a new 5.2km section of two lane highway, bypassing the existing steep, narrow and winding section of SH3 at Mt Messenger; approximately 45 minute drive north of New Plymouth.
The proposed route cuts through the steep terrain of the north Taranaki Hills, requiring two bridges, a number of high embankments, a 230m long tunnel and 15 rock cuttings with a combined distance of approximately 2.5km. Cuts are typically in the 20 to 40m height range, but increase to 60m over short distances. The cuttings are to be formed with a mono-slope of 2V:1H (63°) within the soft-rocks of the late-Miocene Mount Messenger Formation (Mim)[1]. These comprise marine turbidite sands and muds deposited in outer shelf to basin floor settings of the Taranaki Basin, and include a continuum of silty, fine-grained sandstones to silty mudstones, with sub-horizontal bedding, but otherwise, limited defects.
Assessed Risk Level for Rock Cuttings
Hazard identification
In terms of the ARL for the road cuttings, four dominant modes of failure have been identified during the design process following extensive inspections and mapping of local exposures of the Mim in the vicinity of the site and similar ‘papa’ rocks in the wider region. These include:
- Hazard 1: Slabbing failures emanating from the cutting faces, post-construction.
- Hazard 2: Slabbing failures of the natural, steep slopes above the cuttings.
- Hazard 3: Large, defect-controlled failures emanating from the cutting faces and/or natural slopes.
- Hazard 4: Landslip / debris flows of the colluvial soils that mantle the steep slopes above the cuttings following large storm events.
Hazard 1 (H1) was deemed to be by far the most prevalent potential form of instability and resulted in the highest ARL for all cuttings. The remainder of this discussion focuses on the assessment completed for H1.
Slabbing failures, which are very common in the Tertiary-age soft rocks ubiquitous in the central North Island, are believed to result from a combination of stress relief (unloading due to cutting formation) and surface weathering (wetting-drying and heat-cool cycles); and therefore continue indefinitely. This leads to ‘slabs’ of rock which are typically 1 to 3m in length, 1 to 2m high and generally less than 0.3m deep (occasionally up to 0.5m). Some typical examples of slabbing failures within existing cuttings of the Mim are shown in Figure 5.
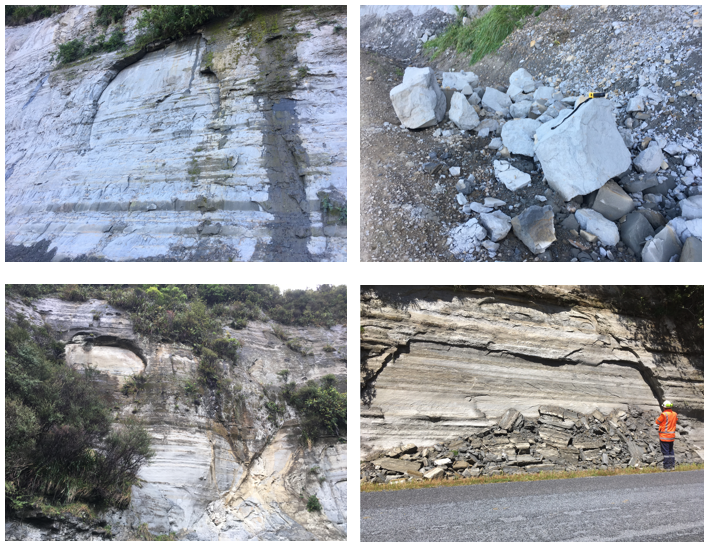
Figure 5: Slabbing failure examples from ‘papa’ rocks close to Mt Messenger.
For the H1 hazard, some of the parameters required for the slope risk assessment were relatively straightforward to determine with a reasonable degree of a confidence, as follows:
Pd – based on inspections and mapping of existing road cuttings and natural rock exposures within the Mim and discussions with road maintenance crews, it was clear that the probability of detachment was going to be high for all cuttings (Pd = 1). For the larger cuttings, more than one rock fall event could be anticipated to occur annually (see below). New slabbing failures were evident on the cuttings along the Mt Messenger section of SH3 between each site visit, indicating the recurrence of these features.
V – the vulnerability of road users to rock falls could also be readily assessed based on evidence of the typical size of blocks expected to reach the carriageway (termed ‘S3’ sized individual blocks in the Guide, with a 0.2 to 0.5m minimum dimension), corresponding to V3. Sensitivity analyses were also undertaken assuming fewer, but larger blocks, and a separate category referred to as ‘loose or wet mixed soil/rock debris’.
Based on the AADT it was determined the Temporal Probability was T3. To allow for future increase I road use, the predicted AADT in 30 years was adopted. Whilst the traffic volume was close to the boundary between T3 and T2, T3 was deemed appropriate based partly on the fact that a significant portion of the traffic on this section of SH3, comprises large freight trucks, which are excluded from the traffic volume in the Guide; which is based purely on the number of cars. The basis for this being the lower risk of fatality from a large truck hitting debris compared to a car.
The combination of V3 and T3 gives a Consequence of C3, as per Table 25 of the Guide (Figure 3).
Travel Probability (Pt)
The main parameter requiring the application of further assessment and engineering judgement, relates to the Travel Probability (Pt). Several approaches were considered to make this assessment, including reference to past failures from road cuttings in similar conditions reaching the carriageway or not, anticipated run-out distances based on the height, slope angle and presence of a catch ditch, and rock fall modelling using Rocscience Inc. RocFall software. These each had their limitations, including:
- Whilst many of the existing rock cuttings are formed at steep angles, similar to the design profile (ranging from 2V:1H to 12V:1H), very few are higher than 15 to 20m, and therefore unrepresentative of the proposed higher cuttings.
- Most estimates of run-out distance and rockfall modelling are based on observations of strong rocks with more spherical / cuboid shapes, unlike the typically weak and tabular shape of the anticipated slabbing failures of the Mim.
An important aspect of the NZTA Minimum Standards for the Mt Messenger Bypass project, was the requirement that cuttings shall achieve an ARL of 3 or better, over the design working life (100 years). Slope risk analysis are typically completed for the conditions pertaining to the slope at the time of the assessment (or upon completion for new roads). By projecting this out over the design life of the cuttings, meant that consideration of how the cuttings may behave in the medium- to long-term and how that may impact the ARL.
This requirement had a major impact on the assessment of travel probability. Preliminary rockfall modelling, based on the relatively smooth cutting faces that would be expected to prevail at the end of construction, suggested rockfalls would have limited trajectory and could readily be intercepted by a relatively narrow and shallow catch ditch at the toe of the cuttings. However, it was clear that over the life of the cuttings, progression of weathering and slabbing failures would lead to an uneven surface and development of launch features able to increase the trajectory of falling rocks away from the toe of the cuttings and potentially onto the carriageway.
To provide a reasonable assessment of this surface relief, digital scans of existing road cuttings, known to have been formed around 30 to 40 years previously, were completed. This surface pattern was imported into the RocFall software and, as expected, resulted in much greater rock fall trajectories, with a number of blocks falling directly onto the carriageway (particularly for source rocks from >20m high).
Whilst this accounted for a relatively small proportion of the total rockfalls modelled (1 to 5%), an estimate was made of the potential number of slabbing failures per year, for each cutting. This estimated number of rockfalls was combined with the percentage predicted to reach the carriageway to provide an indication of the Pt of a single rock reaching the carriageway in any one year. This may be viewed as a deviation from the Guide, in that each individual hazard is assigned a Pt value, placing it in the 0.1 to 0.01 category, but clearly, where many rockfalls are predicted per year, the potential for any one of those rockfalls to reach the carriageway would seem consistent with the intent of the Guide.
The number of rockfalls per year was assessed based on apparent regression rates of existing road cuttings. One of the scanned slopes was known to have been formed 30 years previously and cut at a 2V:1H gradient. By comparing the existing cut face geometry, it was possible to estimate the volume of material lost and converted to an equivalent number of slabbing failures per year (based on average block sizes). This resulted in a Pt of 1.0 for the larger cuttings and 0.1 for the smaller cuttings.
Assessed Risk Level (ARL)
When combined with a probability of detachment, Pd = 1, a Pt = 1 or 0.1 results in a Likelihood of L1 and L2, respectively. With a Consequence of C3, this results in an ARL1 and ARL2, respectively. Based on this assessment, most of the cuttings were deemed not to meet the required ARL3 or better, and required some form of mitigation.
Rockfall trial
This preliminary assessment of the ARL had a significant impact on the project, not only in terms of potential costs, but also on the environmental and landscape objectives. It was therefore decided that a rockfall trial should be conducted to calibrate the rockfall modelling and provide a more realistic assessment of the rockfall trajectories and resulting Pt.
Unfortunately there were no suitable existing cuttings or natural slopes high enough and/or at a similar 2V:1H gradient, but the selected rockfall test site included an approximately 30m high cut face formed at close to 2V:1H, with a natural slope above to assist in releasing rockfalls from higher elevations to provide additional velocity required to replicate the higher cut slopes (Figure 6).
Limited details of the rockfall trial can be provided here, but the testing comprised the release of over 100 rocks ranging in size from approximately 100mm to 500mm from different heights on the cutting face and a small number from the natural slope above. Five cameras were positioned to record the route and trajectories of the falling rocks and to estimate their velocities. This included two high-definition, high-speed cameras attached to UAV’s, one positioned directly above the rockfall, the other facing the cutting, with further cameras located at ground level to provide a side view of the rock trajectories.
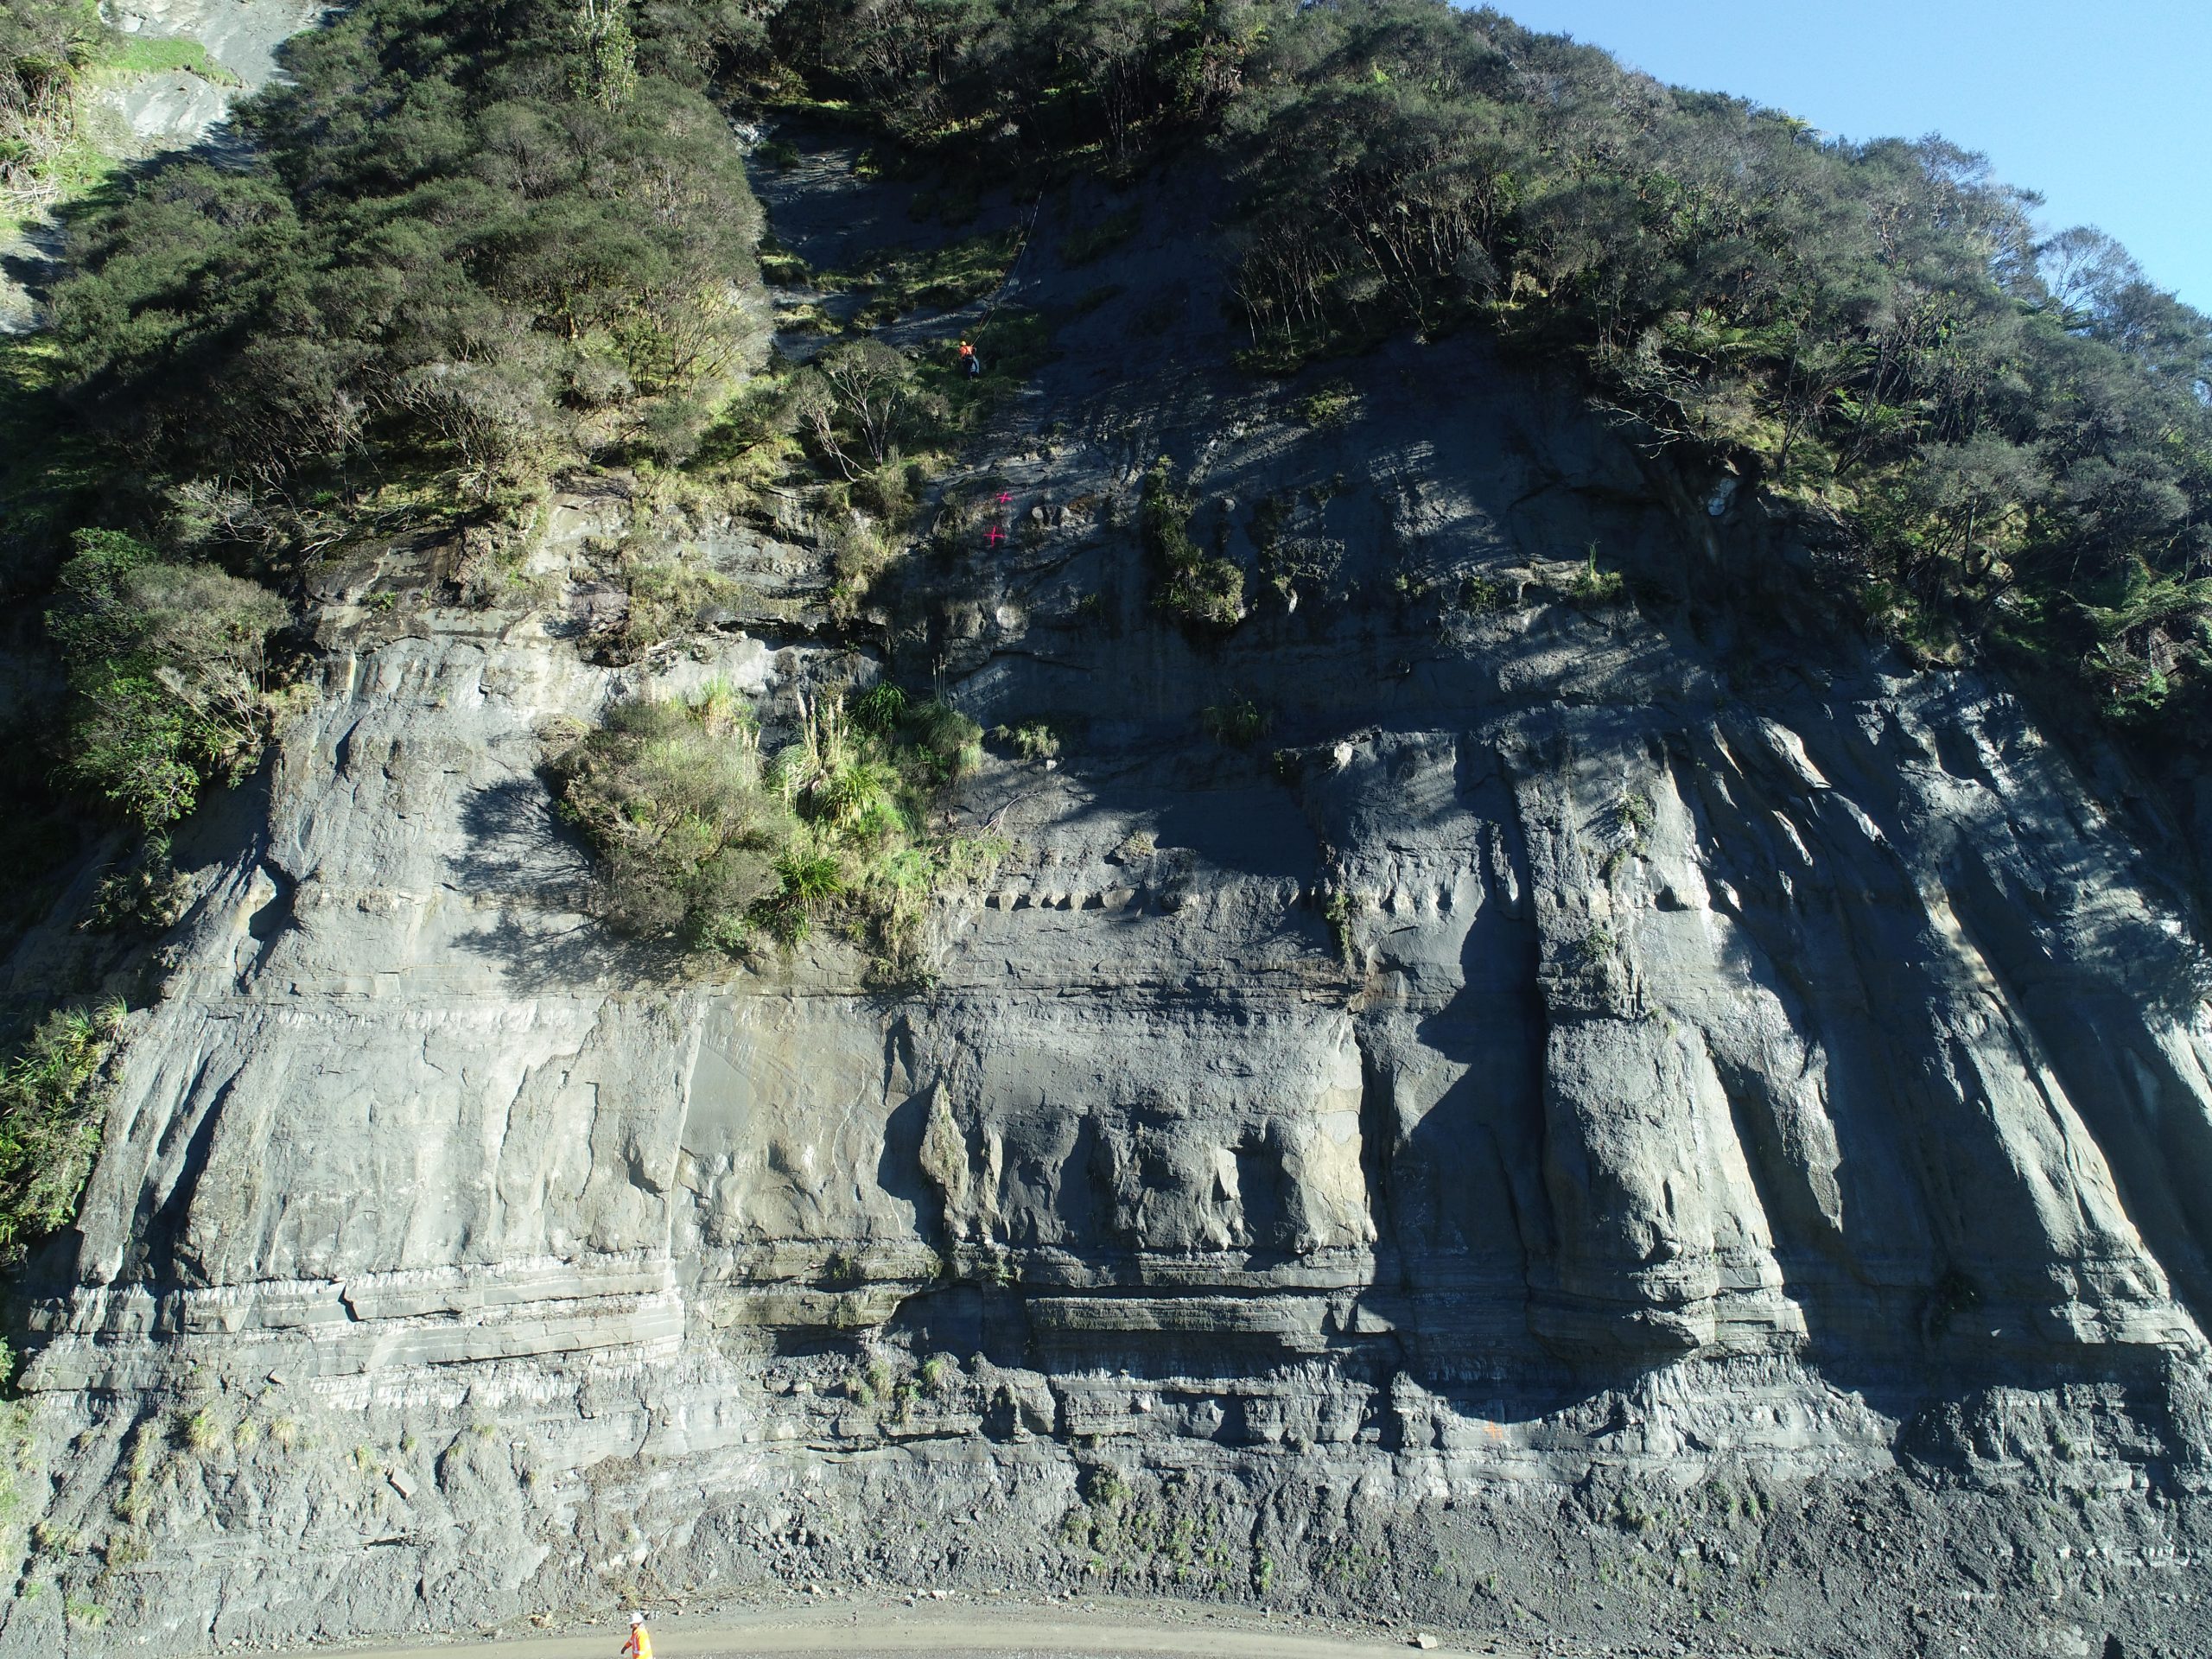
Figure 6: View of rockfall trial site (abseiler in orange on upper central section provides scale).
The results were, somewhat surprisingly, consistent with the rockfall modelling based on the scanned surface of the rockfall trial site. Whilst a large proportion of the rocks fell close to the toe of the cut, a small but significant proportion followed trajectories consistent with the modelled launch features, with several rocks reaching the road carriageway directly (Figure 7).
Many of the falling rocks were also observed to bounce or roll out of the catch ditch onto or across the road. It had been assumed that most blocks landing within the catch ditch would break-up on impact with little or no further travel, and had therefore been discounted from the count of potential rocks reaching the carriageway. It was also interesting to note that once released, the rock slabs very quickly broke-up into smaller rocks which then followed their own path and trajectory, rather than sliding as a single slab and breaking-up on impact at the base of the slope.
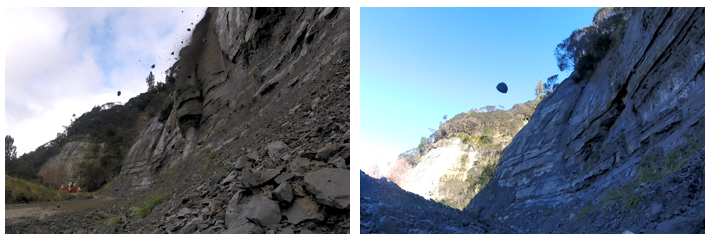
Figure 7: Example rockfalls illustrating possible trajectories during trial.
Mitigation Options
Based on the rockfall modelling, calibrated by the rockfall trial, it was assessed that most of the cuttings should be assigned an ARL of 1 or 2. A number of potential mitigation options were evaluated, including varying the depth and width of the catch ditch, rockfall barriers of different heights / distances from the toe and on the face of the cutting, laying back the cutting slopes to a slacker gradient. The latter option proved largely impractical due to the steepness of the natural topography with cuts ‘chasing’ the slope, making them much higher and introducing a larger face area (and therefore source area for rock fall hazards).
The preferred solution comprised the combination of a minimum 2.7m wide and 1m deep catch-ditch and rock netting system for any cuttings over 20m high. The minimum 2.7m catch-ditch was included primarily to allow vehicle access for ease and safety of maintenance (noting that the lack of clearance of rockfall debris from behind barriers often leads them to be largely ineffective) and to provide a good catch area for the lower cuttings. The catch-ditches double as the drainage swale for stormwater runoff.
The 20m height cut-off for use of rockfall netting was based on modelling results, which indicated rockfalls emanating from heights of <20m had a low probability of reaching the carriageway (Pt = 0.01). Where rock netting is required, this is to extend to the base of the cutting. An option was considered to terminate the netting at 20m above the base of the cuttings, but the assumed exit velocities of falling rocks from beneath the netting suggested a number of rocks could still reach the carriageway. The authors are not aware of any detailed research that enables a realistic assessment of the exit velocity of rocks in such situations and is considered an important area for future research.
With the proposed catch-ditch and rock netting, the high cuttings have an assessed risk level of ARL 5 for H1. For the lower cuttings, where only a catch-ditch is proposed, an ARL 3 is assessed. Based on the remaining hazards (H2, H3 and H4), not specifically addressed by the rock netting, all cuttings were assessed to have an ARL of 3 or 4 for life safety. The slope risk analysis and proposed mitigation measures have been independently peer reviewed as part of the project quality control. Early involvement of the peer reviewer ensured this was a constructive process and added value to the overall assessment.
It is noted that the rock netting may deteriorate before the 100 year design life. However, this does not necessarily mean that the netting will need to be replaced to maintain the ARL 3 or better in the long-term. It is expected that the number of slabbing failures will diminish over time to the extent that the frequency of rockfalls may reduce below the point where the Likelihood reduces sufficiently that the ARL remains at 3 or better without the rockfall netting in place. Also, the 20m and lower cuts which are not proposed to have rock netting, will need to be monitored. Weathering and slabbing may lead to distinct launch features that could result in some rockfall trajectories extending beyond the catch-ditch and potentially reach the carriageway. These aspects highlight the benefit of conducting ARL reviews to monitor changes in the slope behaviour.
Future Modifications for use in New Zealand
Following the successful outcomes of applying the Guide for the Kaikoura, Mt Messenger Bypass and several other smaller capital and maintenance projects, Waka Kotahi will be adopting the Guide modified through a ‘country amendment’ which will detail the parts of the NSW RMS approach that will be adopted together with a small number of modifications to align better to New Zealand conditions.
The NSW ARL approach requires inspections and assessments to be undertaken by accredited persons. Currently accreditation can only be obtained by attending the accredited course in Australia. In line with their intent to continue with this approach, Waka Kotahi has developed its own accreditation course which will cover the new Waka Kotahi/NZTA ARL approach, being a variant of the NSW approach. Successful accreditation will be required to undertake slope assessments on behalf of Waka Kotahi.
Upon successful completion of the course, participants will be accredited to undertake slope assessments for Waka Kotahi. Accreditation will be valid for five years at which time evidence that slope assessments have been undertaken will be required and, subject to satisfactory demonstration, accreditation will be extended for a further five years. Those unable to demonstrate they have been undertaking slope assessments may be required to undertake a refresher course and/or work under supervision.
Conclusions
This paper is intended to help raise awareness within the New Zealand geotechnical community of the use and application of the New South Wales Guide to Slope Risk Analysis and its proposed wider application on Waka Kotahi projects.
The applicability of the risk assessment procedure for new roads in New Zealand has been demonstrated through reference to the Mt Messenger Bypass project. This has highlighted the need for engineering judgement, supported by reasonable investigation and assessment (rockfall modelling supported by field trials) for those parameters that cannot be readily defined during design.
NZTA has adopted a modified version of the Guide for use in New Zealand and is establishing training and accreditation courses for geotechnical practitioners to promote accurate and consistent application on future projects.
References
New South Wales Government, Transport Roads and Maritime Services ‘Guide to Slope Risk Analysis’ Version 4, April 2014.
Landslide Risk Management Concepts and Guidelines. 2000. Australian Geomechanics. (March 2000).
Practice Note Guidelines for Landslide Risk Management. 2007. Australian Geomechanics. Vol 42, No 1 (March 2007).
AS/NZS 4360:2004. Risk management.
Edbrooke, S.W. (compiler) 2005. Geology of the Waikato area. Institute of Geological & Nuclear Sciences 1:250,000 geological map 4. 1 sheet + 68 p. Lower Hutt, New Zealand. Institute of Geological & Nuclear Sciences Limited.
Acknowledgements
The authors would like to acknowledge access to the slope risk analysis completed for the Mt Messenger Bypass project, and thank the Mt Messenger Alliance, Waka Kotahi, the New Zealand Transport Agency, and New South Wales Government, Transport Roads and Maritime Services.
For their input to the Mt Messenger aspects of the paper, Rob Frost (Mt Messenger Alliance), along with staff from Abseil Access Ltd, surveying staff from WSP New Zealand Ltd and traffic management / site support from Downer Enterprises Ltd, for their professionalism and particular attention to health, safety and wellbeing during the long and wet days completing the rockfall trials. Further gratitude to Rob for the many hours (days!) carefully reviewing and cataloguing the recordings from all five cameras, plotting the trajectory paths and calculating velocities for the 100+ rocks, and subsequent calibration of the RocFall modelling. Also, Paul Horrey (Beca Group Ltd) for his diligence, constructive feedback and appropriate challenging of assumptions as independent peer reviewer (engineering geology) for the Mt Messenger Bypass project.
- Edbrooke, S.W. (compiler) 2005: Geology of the Waikato area. Institute of Geological & Nuclear Sciences 1:250,000 geological map 4. 1 sheet + 68 p. Lower Hutt, New Zealand. Institute of Geological & Nuclear Sciences Limited. ↑