Pavement Settlement Monitoring with Mobile Laser Scanning
Lessons from the Monitoring Period at Christchurch Northern Corridor
Abstract
Settlement monitoring of the Christchurch Northern Corridor included detailed road surveys completed using a Mobile Laser Scanning (MLS) system. By combining survey control, a high accuracy Mobile LiDAR system and adapted processing techniques, the solution demonstrated relative precision suitable to detect subtle pavement shape changes and achieved absolute accuracy beyond the normal specifications for this survey technique. The technique provided complete coverage of the pavement which enabled detailed assessment of settlement and grade changes and demonstrated the favourable settlement performance of the finished project.
Overview
The Christchurch Northern Corridor (CNC) project achieved practical completion and opened to traffic in December 2020, and included 8km of ‘greenfields’ four lane motorway, widening of 7.5km of existing motorway and various local road realignments and renewals. 14 bridge structures and Pedestrian Underpasses and 10 major culverts were also constructed as part of the project. The project was designed and built by the CNC Alliance comprising Waka Kotahi, Fulton Hogan, Aurecon and Jacobs.
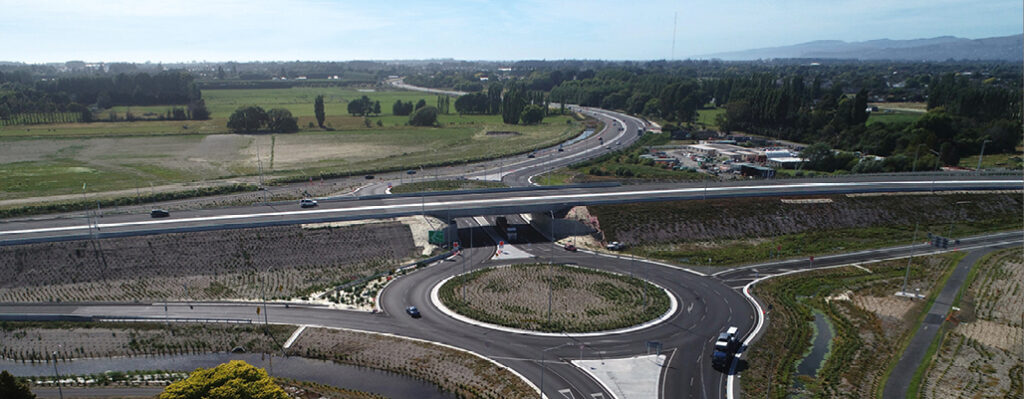
Figure 1 Showing QE2 interchange, which is typical of the project with embankments up to 8m high traversing generally level, soft ground.
The main motorway alignment traverses an area of soft ground in north-east Christchurch including holocene era estuarine and alluvial deposits of soft silt to a depth of 6-12m, with localised peat. Construction settlements were in the order of 0.7m to 1.7m beneath the 7m to 8m high embankments during construction, and up to approximately 0.7m beneath lower height embankments.
The CNC project required thorough monitoring for two years post-construction to confirm that the road was not settling excessively. To undertake this survey using traditional levelling on over 20km of carriageway and 3400+ monitoring points would have taken a survey team with traffic management weeks to complete, at significant additional cost and with associated safety risks to staff from adjacent traffic. To reduce the monitoring cost and improve safety, the CNC Alliance and Woods Surveying team monitored the carriageways with a vehicle mounted Mobile Laser Scanner. This article will discuss the mobile laser scanning process, strengths of the system for monitoring carriageway settlement performance, and the successes that the MLS scan revealed of the original design.
Mobile Laser Scanning for Infrastructure
Internationally, Mobile Laser Scanning (MLS) technology has been applied to road and asset surveying for about 20 years with enormous improvements in accuracy and performance through that time. Systems are now available from a variety of brands in the core surveying industry, with varying balance of accuracy and cost for different applications. The survey industry generally labels the systems into two camps depending on capability; Survey Grade MLS and Mapping Grade MLS. Survey grade suits all applications and meets high accuracy specifications such as the CNC monitoring, while Mapping grade is more suited to tasks like asset location surveying and general mapping.
High quality MLS systems can capture survey data at posted road speed limits, providing advantages for efficiency, scale and safety. Road survey is achievable with no working time required on any live lane and usually with no temporary traffic management requirements, with supplementary survey undertaken from outside the road barriers. For this project the surveyor time in the corridor was reduced by an estimated 90%, and the need for temporary traffic management was entirely avoided.
In the last five years, MLS hardware could be considered matured, and the software race for processing and visualizing MLS data is catching up. There are numerous software and hardware solutions covering all ends of the quality versus cost spectrum. The MLS system used for this project is a VMQ-1HA, a survey grade system manufactured by Riegl which is shown in Figure 2.
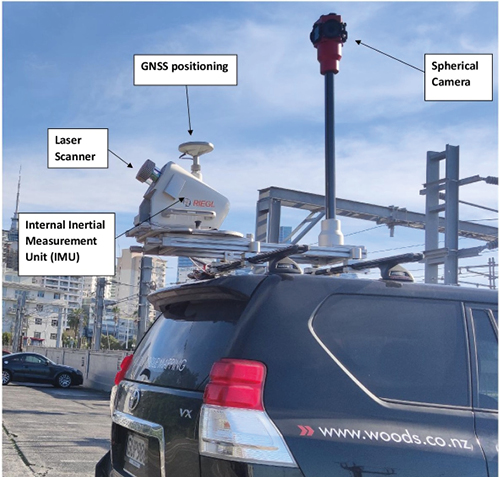
Figure 2 Woods Mobile LiDAR system, a Riegl VMQ-1HA, mounted on a road vehicle
MLS System Accuracy
The accuracy of the laser scanner itself is excellent, with a laser ranging precision of 2mm. The overall accuracy of the system is limited by the accuracy of the Global Navigation Satellite System (GNSS) and Inertial Measurement Unit (IMU), which determine the trajectory and orientation of the scanner.
The GNSS provides absolute positioning and is vulnerable to interference such as outages caused by nearby obstructions of the sky. Errors in the range of 10mm – 40mm are common, and errors up to 100mm may occur a few times within a typical project.
The IMU measures change in position and orientation at a frequency of 200hz and has the most influence over relative accuracy within a scan. Over short periods of time, perhaps up to 10s, it is a higher precision measurement system than the GNSS. Both sources of position are post-processed in a tightly coupled method, enabling smoothing of GNSS from the IMU and orienting the IMU from the GNSS.
The specific scanning methodology used on CNC provided far better accuracy than the total system rating through various pickup and post-processing techniques:
- Local benchmarking: The scan was calibrated using 12 fixed (piled) structures along the alignment, which allow the error in the MLS unit trajectory to be corrected at each structure location. The structures were accurately surveyed to establish the datum and then surveyed to confirm there was no movement. The survey methods for this controls were required to achieve high accuracy over the entire length of the project to provide a consistent datum for the MLS post-processing.
- Averaging: Up to 20 scans were completed each time the road was monitored, and then these were processed to create an average surface, with the ability to remove any outlier scans that didn’t reflect the typical levels.
Several other factors were found to affect the system accuracy, with the methodology adjusted to suit:
- Speed: The MLS unit position is calibrated at each fixed structure and the scanner trajectory is typically subject to drift as the time increases between benchmark locations due to the accuracy of the inertial IMU being time dependent. Scans conducted in busy traffic or with active roadworks had a noticeably reduced accuracy because of the impact on travel times or necessity to stop briefly. Scans were generally completed at night to ensure clear roads and rapid travel, improving the accuracy of the scanner trajectory.
- GNSS Interference: during several missions the Radcliffe Road bridge caused interference to the GNSS system when the vehicle passed underneath. A brief GNSS outage is not necessarily an issue and may have no impact on quality, however this bridge in particular caused errors with unusually high magnitude and unusually common, occurring multiple times on different missions. The bridge has metal decorative finishings on the sides and it is thought that these might be causing an interference known as multipath, whereby the signal is reflected once or several times off a nearby object prior to being received by the GNSS antenna.
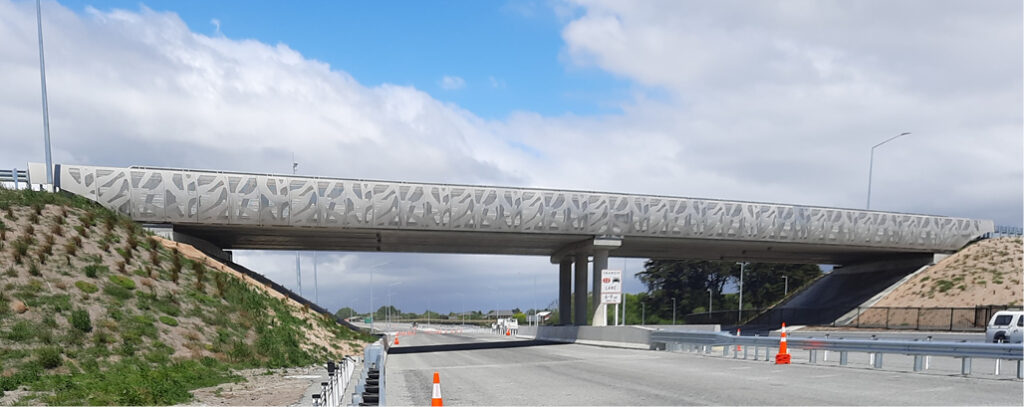
Figure 3: Radcliffe Road Bridge Decorative Panels – Great for aesthetics, not so good for GNSS accuracy.
An assessment of the precision and repeatability of the MLS survey technique was undertaken by comparing the heights of the eight different surveys, with 3414 monitoring points reported by each survey. To minimise the effect of settlement on this comparison it was assumed that the settlement was linear over time and a trend line was computed for each location from which to compute a height difference for every point. All surveys showed similar statistics, with an average standard deviation of 0.0028m at 1 sigma, and 0.0074m at 95% confidence interval. The resulting statistics are shown in Figure 4.

Figure 4: Assessment of MLS precision by comparison of repeat surveys. The average deviation is 0.0074m at 95% confidence.
The MLS results were also validated with a total-station survey of fixed settlement points at key locations, which gave similar data. The final OGPA surface was laid in the middle of the monitoring period, which affected the monitoring results wherever pavement was applied and was not suitably uniform for an offset to be applied. The scan results on the main alignment were therefore interpreted from the data within the road shoulder and median outside the OGPA area.
Example settlement areas
The MLS scan provided excellent data that enabled any areas of developing settlement to be identified and assessed. Several examples of areas of settlement identified during the DLP period are highlighted in this section to show the capability of the MLS scanning, and key design successes.
South of the Belfast Interchange, a creek was realigned, and the channel backfilled in an area with several metres thickness of peat at a depth of around 4m below ground level. Although this area of increased fill thickness had additional surcharge, some ongoing settlement was observed related to this backfilled creek. The settlement is shown on Figure 5 below, overlaid on the pre and post-construction aerial photographs to show the creek alignment and final geometry. The grade change can be measured directly from the scan and is in the order of 1/2000 (0.05%) longitudinal, so is not perceptible while driving. The worst transverse grade change in this location was measured at about 0.025%.
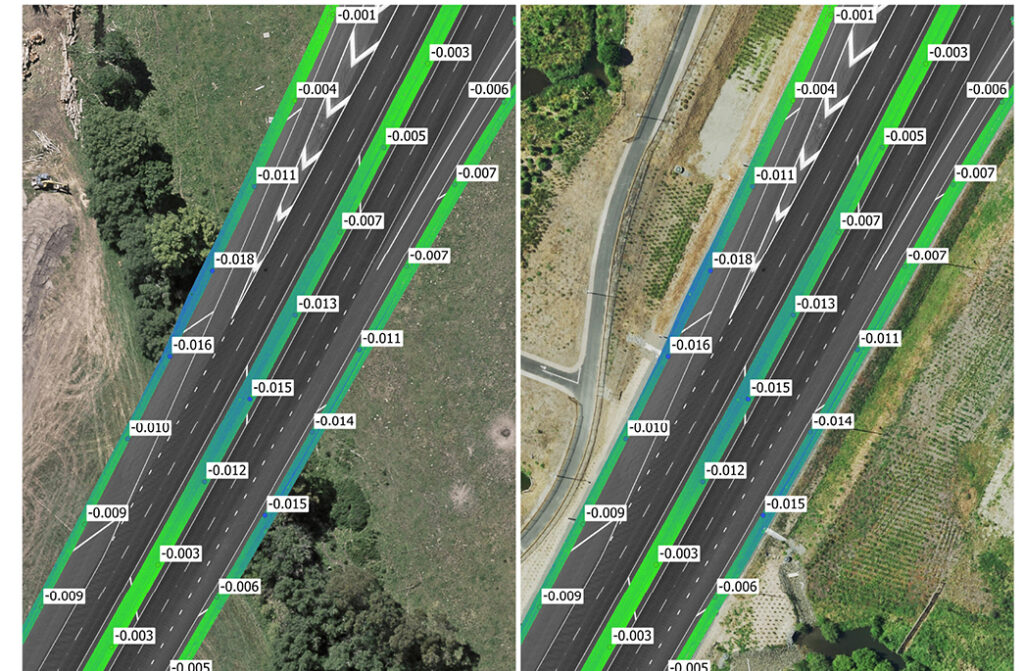
Figure 5: Settlement due to stream realignment. Figure 4A shows the settlement map with aerial imagery preceding the project earthworks. Figure 4B aerial image is from Feb 2021 showing the completed project.
A focus of the design was to reduce the differential settlement across transitions between areas of rigid ground improvement at bridge abutments, and the adjacent embankments where settlement was mitigated by wick drains and surcharge. The adjacent embankments were wick-drained and surcharged with the design typically aiming to achieve a surcharge ratio of 0.2 (OCR 1.2 post-surcharge removal) at critical interfaces. This settlement design strategy was successful despite the large observed settlements during construction, with minimal differential settlement observed in the monitoring period. One embankment where some ongoing movement was observed is Radcliffe Road, which is a 60km/h local road crossing, with the west abutment shown in Figure 6 below.

Figure 6: Settlement map and charting of the three highlighted monitoring points on the western embankment of Radcliffe overbridge.
The MLS scan showed the gradual development of minor differential settlement at the western abutment of Radcliffe Road Bridge during the monitoring period. The influence of the rigid ground improvement is apparent, with minimal settlement within the improved ground.
Conclusion
The MLS scanning technique introduces multiple sources of measurement errors compared with conventional levelling, however, with the use of specialised equipment, repeated passes and post-processing workflows, the technique provided high quality data that consistently identified areas of settlement on the CNC project. The method provided significant time, cost and safety benefits to the project relative to traditional levelling.
The tradeoff of reduced absolute settlement accuracy compared with conventional levelling is mitigated by the differential settlement accuracy, and the increased level of detail provided by a full pavement scan. The system gave excellent data for shape or profile changes due to settlement and showed clear trends with settlement progression observed through the duration of the monitoring period. The results provided suitable confidence in the performance of the project into the future.