Re: Cantilever Pole Retaining Walls, John Wood
I read John Wood’s excellent feature article on the above topic with interest and found that John has provided answers to many questions that, as a designer, I have been keen to see addressed and where possible resolved.
As a check on John’s recommended LFP for a single pole in cohesive soil, I compared his findings to those published by Pender and Rogers (2016) following their full scale load testing in residual Auckland clay soils (see copy of paper attached).
In addition to this information, I also attach a copy of my own calculations which, if correct, indicate that Pender and Rodgers Equation 5 seems to produce results much closer to the measured test values than John’s approach. On this basis, I would tend to agree with Pender and Rodgers comment in the last sentence of Section 4.2 of their paper (p. 183) that:
“However, what is clear from Figure 14 is that the suggestion that the ultimate lateral pressure reaches 9su at a depth of three embedment diameters (Broms, 1964) is not applicable to poles embedded in Auckland residual clay”.
A similar comment might also be applicable to John’s work.
I would be pleased if John would review my comments above and provide any feedback that he considers appropriate.
Regards
Peter Marchant, ME (Civil),
CPEng, CMEngNZ, IntPE
Principal Geotechnical Engineer
peter.marchant@tetratech.com
Tetra Tech Coffey (NZ)
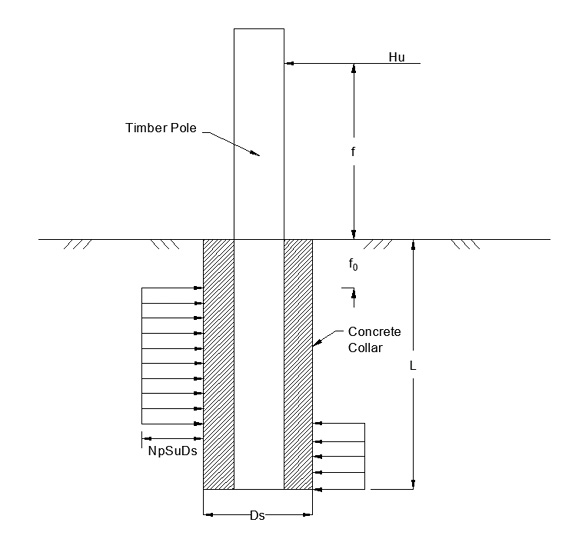
Figure 1: Definition Sketch
Objective:
John Wood NZGS Journal “NZ Geomechanics News” June 2021 Issue 101 “Cantilever Pole Retaining Walls” section 5.9, last paragraph, p. 44 states that:
Z = 0.5B and Np = 11 gives good agreement with 50 tests presented by Chen & Kulhawy, 1994.
Now compare John Wood’s recommendation with the findings of Pender and Rodgers 2016 (P & R 2016) who carried out 11 field trials on single, concrete collared, timber poles embedded in Auckland residual clays.
For John Wood’s approach
f0 = Z = 0.5B = 0.5Ds
Np=11
Modifying Pender & Rodgers 2016 Equation 1 and replacing f with f0 in the second bracketed term within the square root symbol, owing to an error in the published article, we get:
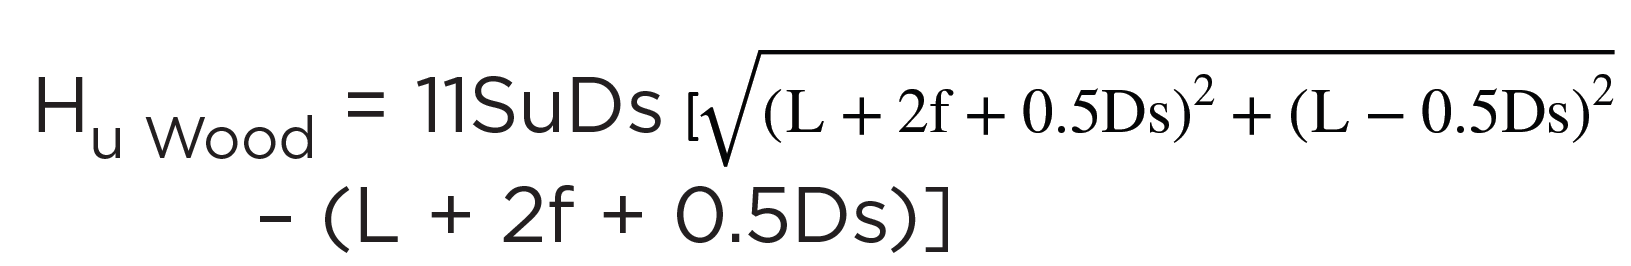
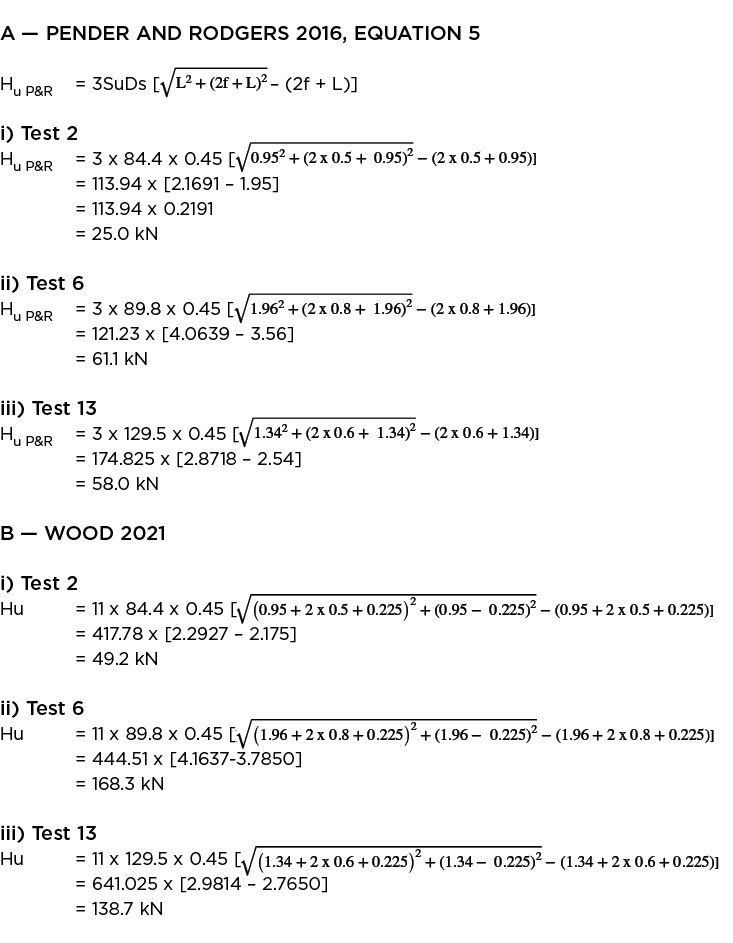
We can substitute appropriate values into the above expression and check them against the recorded field results presented as Table 2 of P & R 2016. I’ve only done this for Tests 2, 6 and 13 which covers L/Ds ratios ranging from approximately 2 to 4. I also include calculated Hu values using P & R’s 2016, Equation 5 with f0 = 0 m and Np = 3.
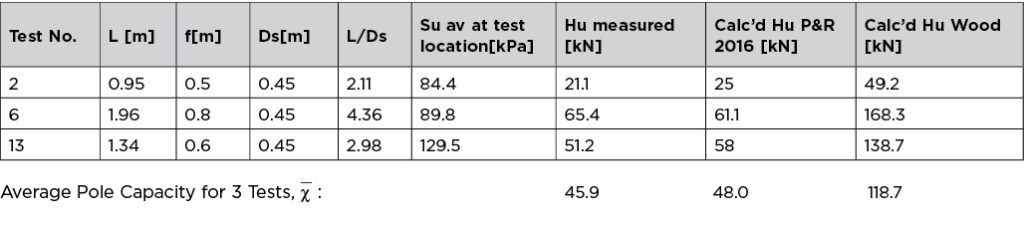
Conclusion:
Compared to the measured results the P&R 2016 expression Equation 5 produces reasonably accurate information but Wood 2021 significantly overestimates the pole capacities.
Calculations:
Response From John Wood to: Letter to Editor of NZ Geomechanics News from Peter Marchant 16 August 2021.
I thank Peter Marchant for his helpful comments on my June 2021 paper; Cantilever Pole Retaining Walls. I was not aware of the 2016 paper by Pender and Rogers, which Peter refers to, when I wrote my June 2021 paper. The Pender and Rogers paper is relevant since it reports lateral load tests on rigid timber poles in an Auckland clay soil. The embedded lengths and diameters of the poles were similar to those that might be used in low height cantilever pole walls.
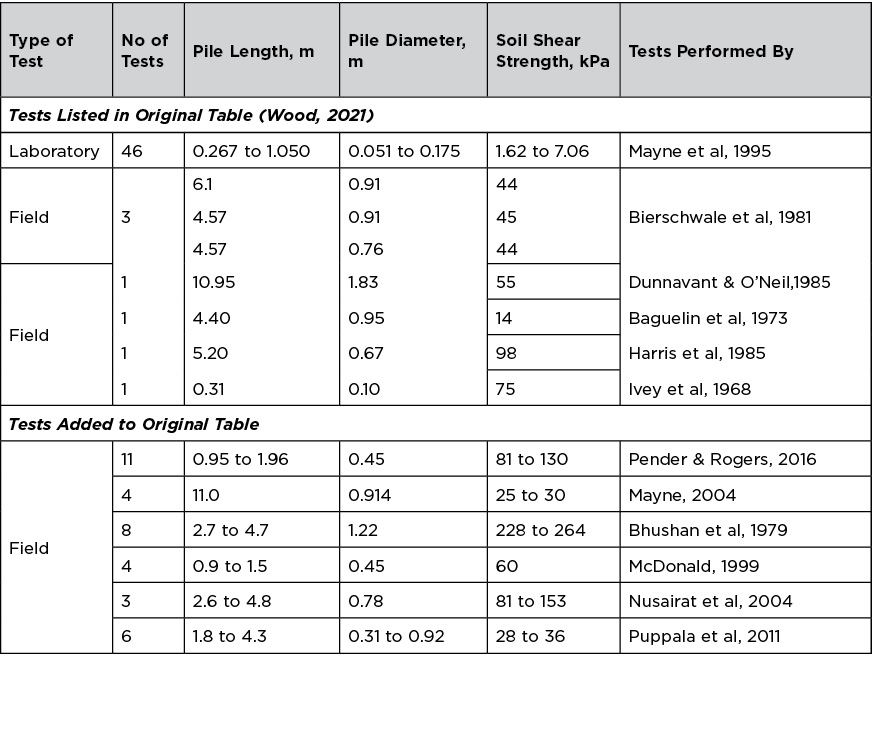
My recommendation for estimating the lateral load ultimate (hyperbolic) capacity using a bearing capacity factor, Np = 11 and a depth of zero resistance, zt = 0.5B (where B is the embedded diameter) was based on the analysis of the test results given in my Table 5 which is reproduced below with some additional load test information added. The four last entries in the revised table (21 field tests) were obtained from the information given in Georgiadis et al, 2013. This paper was not reviewed by me prior to publication of my paper. (The tests by Mayne, 2004 were not used in my 2021 paper as the length to diameter ratio of the piles was approximately 12 and it was not clear that the piles failed by rigid rotation.)
Table 5. Lateral Load Tests on Rigid Pile Tests in Clay Soil. From Wood, 2012 with Additions
The ratio of the calculated ultimate pile capacity using Np = 11 and zt = 0.5B to the reported test capacity (Hu/Qu; hyperbolic capacity) is shown in Figure 1 for all the tests listed in Table 5 above. The ratio is plotted against the eccentricity ratio (e/L, where e is the eccentricity and L the embedded pile length) as this is an important parameter that has a major influence on the capacity. (For cantilever pole walls designed for a clay soil foundation this ratio varies from about 0.1 to 0.4). The mean ratio of Hu/Qu for the tests reported in Wood, 2021 was 0.99; however, with the additional tests, excluding the Pender and Rogers tests, this ratio increases to 1.07.
Figure 1. Comparison of the ratio of calculated to test ultimate capacities for the tests listed in Table 5 above.
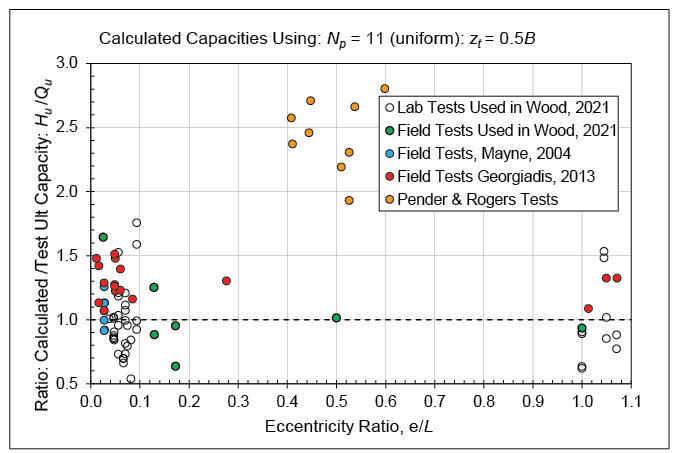
My recommendation for calculating the hyperbolic capacity given in the 2021 paper overestimates the Pender and Rogers results by an average factor of about 2.5. There is no obvious reason for this large discrepancy. For design I recommended using a lateral load capacity based on yield of the soil at the pile toe which gives capacities about 25% lower than the ultimate hyperbolic capacity.
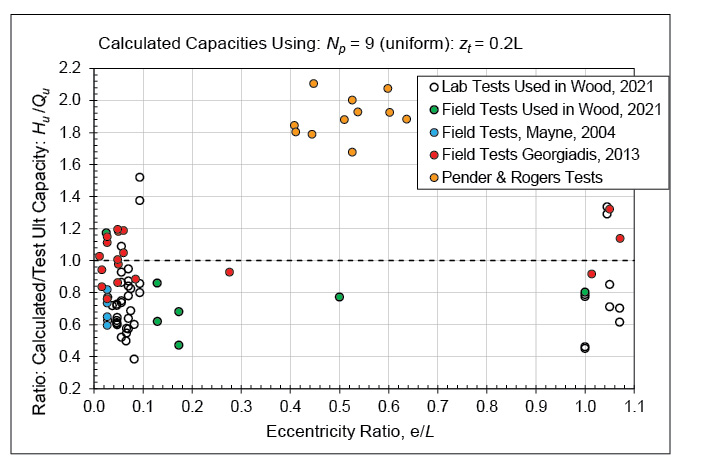
In view of the additional test information and the relatively wide scatter in the Hu/Qu ratio I now recommend calculating the ultimate capacity for design applications using Np = 9 and zt = 0.2L. (Broms recommended Np = 9 and zt = 1.5B). For cantilever walls with relatively short embedment lengths of about 1.5 to 3.5 m it is perhaps more logical to base the zero-resistance depth on the embedded length rather than the diameter. Using 0.2L gives typical wall foundation soil zero resistance depths of 300 to 600 mm. Figure 2 shows the Hu/Qu ratio for the tests listed in Table 5 above using Np = 9 and zt = 0.2L. The average ratio for all tests excluding the Pender and Rogers tests is 0.84. Even with these revised parameters Figure 2 shows that the Pender and Rogers test results are overestimated by an average factor of about 1.9.
Figure 2. Comparison of the ratio of calculated to test ultimate capacities for the tests listed in Table 5 above. The calculated ultimate hyperbolic capacity is based on modification of the Wood, 2021 parameters with Np = 9 and zt = 0.2L.
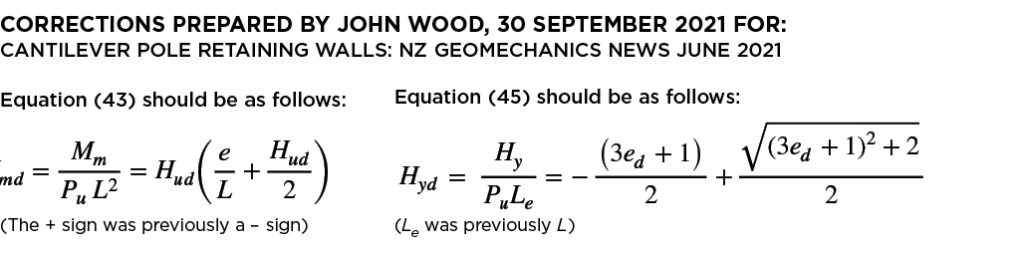
I still recommend that the toe yield capacity be used in design rather that the hyperbolic ultimate capacity. Equation 45 in my 2021 paper allows this capacity to be calculated using the modified parameters or any other value of these parameters. (Likewise, Equation 40 enables the ultimate hyperbolic capacity to be calculated for any value of Np and zt.)
Georgiadis et al, 2013 present an analytical method of calculating the ultimate lateral capacity of rigid piles in a cohesive soil that was not considered in my 2021 paper. Based on the results of 3D finite element analyses and pile load test results they proposed the following Np versus z/B relationship that takes into account the soil adhesion to the pile:
Georgiadis & Georgiadis Eq. 2
Where λ= 0.55 – 0.15α ; α is the pile-soil adhesion factor that ranges from 0 for a smooth pile to 1.0 for a rough pile. Npo = 2 + 1.5α, is the bearing capacity factor at the ground surface and Npu the ultimate lateral bearing factor for deep failure (see Equation 39 in Wood, 2021).
Figure 3 from Georgiadis et al compares their Np versus z/B relationship with a number of others that have been obtained experimentally, analytically, or numerically. There is a wide scatter in the relationships part of which was attributed to the significant dependence of the lateral soil reaction on the pile-soil adhesion. The Georgiadis et al relationship and some of the others indicate that Np does not reach the ultimate value until a depth of six diameters or greater. For the relatively short pile embedment depths used in cantilever pole walls this indicates that variation in Np might occur over the full embedment depth.
Figure 3. Variation of lateral bearing capacity factor with depth.
From Georgiadis et al, 2013.

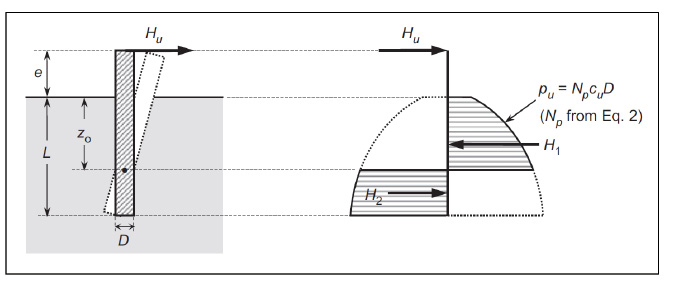
Figure 4 illustrates the lateral earth pressure assumption used by Georgiadis et al, 2013 to develop analytical equations for the ultimate hyperbolic lateral pile capacity. Their closed from equations are quite complex and require iteration to evaluate. Because of the variation of Np with depth the capacity equations are a function of the B/L ratio as well as the e/L ratio.
Figure 4. Lateral earth pressures on rigid pile at ultimate capacity.
From Georgiadis et al, 2013.
Because of the wide discrepancies noted above between the Pender and Rogers test results and the other tests the Georgiadis et al analytical method was used to calculate the ultimate capacities of the piles used in the Pender and Rogers tests.
Figure 5 shows the Hu/Qu ratios which average approximately 1.6. The Georgiadis et al method was applied assuming α = 0 (smooth pile). A more realistic value is probably 0.5 and this would increase the calculated values by approximately 20%.
Also plotted in Figure 5 is the ultimate capacity ratio calculated assuming Np varies linearly from 2 at the surface to 9 at a depth of 9B. This lateral bearing capacity function gives an average ratio of calculated divided by test ultimate capacity of 1.0 and was used in Pender and Rogers who also investigated using a Np of 3 uniform over the depth of the pile (Equation 5 in their paper). This also gave good agreement between the calculated and test capacities with an average capacity ratio of 1.0.
Figure 5. Ratios of calculated divided by test capacities using both Georgiadis et al and a linear variation of Np with depth used by Pender and Rogers.
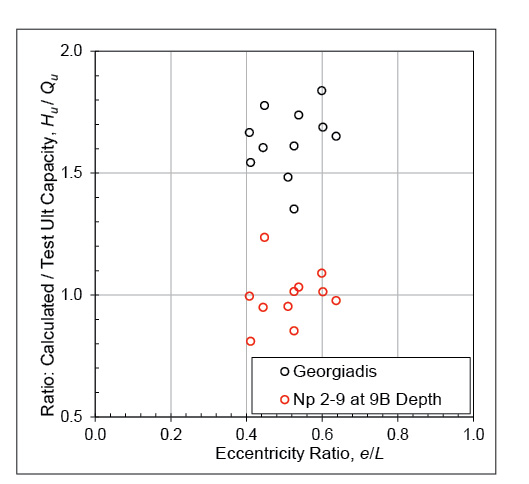
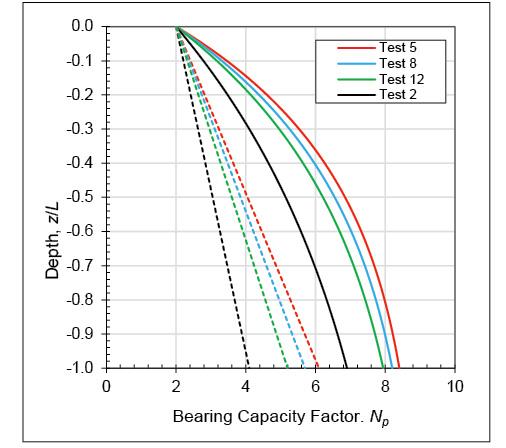
Figure 6 shows the Np versus depth function used to calculate the capacity ratios plotted in Figure 5 for four of the 12 tests which had typical L values. There are significant differences between the function proposed by Georgiadis et al and the linear function investigated in Pender and Rogers. These differences account for the large difference in the capacity ratios obtained from the two methods. Both have an Np of 2 at the surface but as shown in Figure 3 the Georgiadis et al Np at the surface increases to 3.5 for α = 1.0 (rough pile).
Figure 6. Bearing capacity functions using both Georgiadis et al (full lines) and the linear variation investigated by Pender and Rogers (dashed lines).
A comparison between the ultimate capacity (hyperbolic) calculated using Georgiadis et al and Equation 40 in Wood, 2021 with zt equal to both 0 and 0.2L (Np uniform with depth over the remaining embeddment) is shown in Figure 7. Georgiadis et al capacities for L/B values of 6 and 4 are shown in the figure to cover the range of typical values used in cantilever pole walls. An adhesion factor of 0.5 (intermediate roughness) was used to calculate the Georgiadis et al capacities. For the purpose of the comparison the force per unit length, Pu in the dimensionless capacity parameter for Georgiadis et al was taken as Pu = su B Np where Np = 9. So, to convert these dimensionless capacities in force units a Np of 9 needs to be used (although any appropriate Np can be used when the Np value is uniform with depth.)
Figure 7. Ultimate capacities from Georgiadis et al and Equation 40 in Wood, 2021.

The ultimate capacity curves in Figure 7 show reasonably good agreement between the capacities calculated by the Georgiadis et al analysis method for L/B ratios of 4 to 6 and assuming a zt of 0.2L and a Np of 9 uniform over the remaining depth of the pile.
There does not appear to be any obvious explanation for the low test results obtained by Pender and Rogers. Until further investigation of the clay soil that was used in their tests is carried out including their measurement of su, I recommend that the design of pole walls in clay soil be based on toe yield capacities with a zt of 0.2L and a Np of 9 unform with depth. Equation 45 in my paper can be used to estimate this capacity. If appropriate strength reduction factors are used this should result in a satisfactory wall design in most clay foundation soils.
References
- Georgiadis K, Georgiadis M, and Anagnostopoulos C. 2013. Lateral Bearing Capacity of Rigid Piles Near Clay Slopes. Soils and Foundations 2013: 53(1) pp 144-154.
- Pender M and Rogers P. 2015. Ultimate Lateral Capacity of Timber Poles Embedded in Clay. Geotechnical Engineering, ICE, 169 (GE2), pp 175-186.
- Wood J. 2021. Cantilever Pole Retaining Walls. NZ Geomechanics News, June. Pp 16-60.