
ABSTRACT
Previous studies have shown that pumice particles are highly crushable, compressible and lightweight as a result of their vesicular nature. Hence, they are problematic from an engineering viewpoint. Currently, there is limited information on the geotechnical characteristics of pumice deposits. To address this, empirical observations and laboratory tests have been conducted with the aim of characterising the behaviour of crushable pumice sands. However, such tests are generally time-consuming and expensive. These drawbacks have motivated attempts to study the effects of particle breakage of pumice sand through Discrete Element Method (DEM). DEM is a promising solution as it provides insights into the behaviour of granular materials at both a micro- and macro-level. To better understand the effect of particle crushing in pumice sand specimens, DEM has been used in this study to simulate the behaviour of pumice sand during 1-D compression tests using the open-source code YADE. Results indicate the importance of incorporating particle crushing in pumice characterisation. The DEM simulation conducted to simulate 1D compression test on pumice sand can mimic the evolution of the particle size distribution post-testing.
INTRODUCTION
Due to the tectonic location of New Zealand, it is important for engineers to understand the properties of local soils when they are designing and building structures (Fieldes, 1968; Orense et al. 2013). Pumice sand deposits, which are particularly problematic from an engineering perspective, have been found in a number of locations in the North Island (Orense & Pender 2013; Wesley et al. 1999). Pumice particles are problematic due to their distinctive properties (Orense et al. 2013); they are highly crushable, have irregular surfaces and are lightweight as a result of their vesicular nature (Wesley et al. 1999) . The information currently available on the geotechnical characteristics of pumice sands is limited. This can be attributed to the time-consuming and expensive nature of laboratory testing which have been implemented to characterise its behaviour. Due to these drawbacks, Discrete Element Method (DEM) has been employed by some researchers (Ciantia et al. 2015; Ciantia et al. 2019; de Bono & McDowell 2014) to study the effects of particle breakage on sand behaviour. These studies have provided valuable insights into the role of crushing of the granular material at both a micro- and macro-level.
DEM, originally proposed by Cundall & Strack (1979), is considered to be an effective tool for studying the micromechanical behaviour of granular materials. Recently, it has been extended to model particle crushing of granular materials. Using the software PFC3D, Robertson & Bolton (2001) simulated crushable aggregates by modelling each particle as an agglomerate made up of elementary balls held together by contact bonds in hexagonal close packing (HCP). They discovered that by randomly removing some balls in the agglomerate, a Weibull distribution of crushing strength could be produced. Harireche & McDowell (2003) furthered Robertson & Bolton’s approach by reproducing the particle size effect on crushing strength while simulating a normal compression test on crushable sand. Cheng et al. (2004) also drew upon Robertson & Bolton’s method to model the statistical strength of silica sand in which they simulated both isotropic compression and conventional triaxial compression tests. Based on the theory proposed by Russell & Muir Wood (2009), Ciantia et al. (2015) studied the micro and macro-mechanical behaviour of crushable sand.
Thus, in order to supplement existing laboratory test results, DEM was used to provide better insights on the micro- and macro-response of crushable NZ pumice sands. In this paper, the open source software YADE (Šmilauer et al. 2015) was used to conduct the DEM simulations. A pumice particle is represented by a multi-sphere particle which can split upon reaching the limiting stress condition. Initially, the results of a series of single particle crushing test on 2 mm diameter pumice particles were simulated and the results were represented statistically using the Weibull distribution to characterise the variation of the particle strength with particle size. Next, model specimens consisting of thousands of discrete elements assembled with different relative densities were subjected to 1D compression tests to simulate the results reported by Wesley et al. (1999). The impact of particle crushing behaviour of pumice sands when subjected to 1D compression was analysed and the evolution of particle size distributions after the tests was discussed.
PARTICLE CRUSHING CRITERIA
As particle crushing criteria, a linear elastic formulation was used following the approach of Ciantia et al. (2015). In this criterion, a particle breaks if the force (F), at any of its contacts, is such that:
(1)
where is the limit strength value which is dependent on material parameters, and the contact area is . The clear separation of the two aspects of grain failure, namely strength criterion and elastic stress distribution, is one attractive aspect of this criterion, as properties governing contact area can take on very different values in single particle tests and granular assemblies. The limit strength factor, , depends on the particle diameter, d, as follows:
(2)
whereis the mean limit strength of a particle with diameter d0, which is the reference diameter (here chosen as 2 mm), m is the Weibull modulus, and depends on the elastic properties and the contact force of a particle. The following expression can be obtained by using the linear contact theory in the breakage criterion (Ciantia et al. 2019):
(3)
where r1 and r2 are the radii of the contacting spheres, and Ei and vi are, respectively, the Young’s moduli and Poisson’s ratios. Note that this breakage test does not only apply to the highest particulate force, but the properties of the interacting particles also have a closely interconnected dependency. Once the limit condition is reached, a particle, modelled with a sphere in YADE, will split into smaller, inscribed tangent spheres. Ciantia et al. (2015) detailed this procedure and compared alternative splitting configurations of the particle. They concluded that the 14-ball splitting configuration, shown in Figure 1(b), is accurate enough to simulate the macroscopic behaviour. After crushing, exemplified by the splitting of the smaller spheres, the daughter fragments assume the velocity and material parameters of the mother particle, except for the intrinsic strength , which is randomly distributed among the particles.
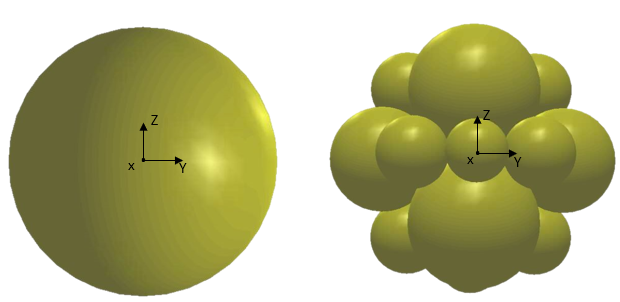
Daughter fragments
(a)
(b)
Mother particle
Figure 1: (a) Initial particle; (b) Particle splitting configuration
SAMPLE PREPARATION FOR 1- D COMPRESSION TEST
In the DEM simulation, a 12 mm cubic specimen was used for the 1D compression test; it consisted of 10,000 spheres, as displayed in Figure 2. The specimen consisted of sand with the same particle size distribution as that reported by Pender et al. (2006), as shown in Figure 3. Two types of pumice sand specimens were considered having different relative densities, Dr (15% and 68%). Note that these models were scaled-down versions of the original specimens used in the 1D compression test with rigid boundaries. While the specimen size (12×12×12 mm) was small, it was deemed large enough to permit a sufficient number of force chains to develop between the top and bottom platens during the 1D compression test. Larger model specimen sizes would require more particles, and much longer computational time.

12 mm
Figure 2: 1D compression test specimen at initial state with 10,000 particles.
Figure 3: Experimental and numerical particle size distributions (PSD) of pumice sand.
The particles in the cubic DEM specimen were first created using the Radius Expansion method (REM) (Ciantia et al. 2015). In this study, two different contact models were adopted and compared: Linear and Hertz-Mindlin. These models require the generation of a wide range of particle sizes during the simulation and are able to describe the interaction between the discrete spherical elements. The Linear contact model obeys the Coulomb friction law, which can be expressed by a linear relationship between the normal force and the allowable shear force. It describes the constitutive behaviour in normal and tangential directions between particles at their contact interface by adopting linear springs with normal and shear stiffnesses (Cundall & Strack, 1979). A rolling resistance model, based on the formulation of Iwashita & Oda (1998), was incorporated to simulate the surface roughness of pumice particles. On the other hand, the Hertz-Mindlin (no-slip) contact model makes use of nonlinear force-displacement formulations to calculate the normal and shear forces during analysis. It considers the variation of stiffness as a function of the elastic constants of the two contacting particles, the overlap and the normal force.
The density of the particles was set as 2000 kg/m3, reflecting the measured average value for pumice sand, with a particle friction coefficient of 40 degrees (Orense et al. 2012). Also, values of 30.1 MPa and 0.25 were used to represent the Young modulus and Poisson’s ratio of pumice sand. The calibration of the parameters of the DEM contact model are summarised in Table 1. After REM application was finished, the particle velocities were set to zero and an isotropic compression stress of 5 kPa was applied in order to bound the particles without crushing them, mimicking the experimental sample preparation procedure. The sample was then loaded vertically so that the top platen moved downwards, with the maximum platen velocity set at 0.01 m/s, consistent with the loading rate used in the actual tests.
Table : Summary of DEM parameters for the 1D compression test simulation.
| Physical parameters | Value |
| Friction coefficient (rad) | 0.7 |
| Young’s modulus (MPa) | 30.1 |
| Rolling stiffness coefficient | 0.125 |
| Rolling strength coefficient | 0.1 |
| Poisson’s ratio | 0.25 |
| Density (kg/m3) | 2000 |
| Friction coefficient of wall | 0 |
| Young’s modulus (MPa) of wall | 80 |
| Poisson’s ratio for wall | 0.35 |
MODELLING PARTICLE STRENGTH-SIZE RELATION
Many researchers (e.g. Cheng et al. 2004; McDowell & Harireche 2002) have reported that there is a strong relationship between particle crushing strength and particle size. One of the best methods for identifying such relationship is via statistical analysis (McDowell & Harireche 2002). Among the statistical distribution functions, the Weibull (1951) distribution is the most widely used to analyse strength measurements and lifetime predictions of sand particles. McDowell & Amon (2000) explained this phenomenon mathematically based on different particle sizes. Orense et al. (2013) had confirmed that crushing strength is an induced characteristic stress for a single particle of initial height h0 loaded under a maximum load F as follows:
| (1) |
The data for crushing stress at failure for each set of tests (consisting of particles with roughly 2 mm diameter) were first ranked in ascending order to compute the survival probability () of each particle based on its mean rank position in the order: where is the ranked sample from a total of N samples (Cheng et al. 2004). The pumice particle and variation of strength in each set of tests were quantified using Weibull (1951) analysis, such that the survival probability of a particle size d under a crushing stress is given by:
| (2) |
where is the value of the characteristic stress for particles of size such that 37% of the particles survive; and m is the Weibull modulus, which decreases with increasing strength variability (McDowell & Harireche 2002). Equation (5) can then be rewritten as:
| (6) |
In the current study, the above equation was used to estimate the Weibull modulus for pumice sand particles with 2 mm diameter based on actual and simulated single particle crushing tests. Figure 4(a) shows that a similarly shaped survival probability curve was achieved in the DEM simulation as that in actual crushing strength tests on pumice sand particles. Moreover, Figure 4(b), which illustrates the Weibull probability distributions obtained from the laboratory experiments and the DEM simulations, shows a good level of
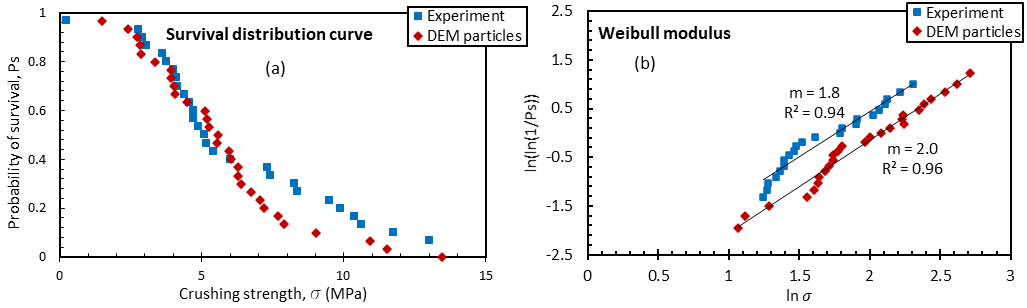
Figure 4: (a) Survival distribution curve from single particle crushing for simulated particles; (b) Determination of Weibull modulus.
agreement. From the slope of the fitted lines in Figure 4(b), the values of the Weibull modulus are 1.8 and 2.0 for the actual test and simulation, respectively; hence, the Weibull modulus can be taken to be roughly equal to 1.9; this was taken as a guide to establish a normalised particle size strength dependency for pumice sand, as expressed by Equations (1) and (2).
RESULTS
Using the pumice sand characteristics obtained as obtained above, a simulation of 1D compression tests on pumice sand specimen is next conducted. Here, the effects of two different modelling characteristics were investigated: (1) contact stiffness description (Linear or Hertz-Mindlin); and (2) crushing behaviour. In the results presented below, the code for the numerical simulations identifies the contact law adopted (i.e. “Lin” stands for linear, and “Hertz” for Hertz-Mindlin). Similar to the actual experiments, the numerical tests were conducted under load control. For illustration purposes, Figure 5 shows the results of 1D compression test on non-crushable particles and it clearly illustrates that there is a huge difference between the experimental results with those using either Linear or Hertz-Mindlin contact models. As expected, without grain crushing, both models are not able to replicate the experimental behaviour of pumice sand specimen.
Next, Figure 6 shows the results of 1-D compression tests on pumice sand where particle crushing is allowed. Compared with Figure 5, it is clear that the behaviour of pumice sand specimen under compression is dominated by particle crushing. From the 1D compression test simulation results, the non-linear Hertzian contact model resulted in larger deformation than the linear contact model, possibly the result of excessive particle overlap at high pressure, leading to overestimation of the change in porosity. Another possible reason that may have contributed to the difference in the results is the effect of surface roughness of particles during contact, which cannot be accurately simulated by the Hertz contact model. On the other hand, the linear contact model, which incorporates the rolling resistance of the particles, is able to simulate well the experimental results reported by Wesley et al. (1999). This suggests that the DEM simulation using linear contact model, which can consider both crushing potential and surface roughness of pumice particles, can mimic the micro-mechanical behaviour of pumice sands. It is worthy to mention that the computational cost can also be reduced significantly by using the linear contact model when simulating irregular particles.
Finally, Figure 7 illustrates the evolution of the PSD of loose and medium dense pumice sand specimens before and after the tests. Clearly, the loose specimen underwent less particle crushing because there are a lot of voids in the specimen, allowing the particles to rotate and rearrange readily, without being crushed. On the other hand, the rotation and movement of particles in the medium dense specimen are restricted by the adjacent particles due to less voids available, resulting in more crushing in these specimens. Moreover, the overall number of contacts between particles in a denser specimen is higher than a loose specimen. Therefore, the greater number of contacts results in greater possibility of a particle being crushed.
b
Figure 5: DEM simulation of 1D compression test without crushing of particles: (a) loose specimen (Dr=15%); and (b) medium dense specimen (Dr=68%).
Figure 6: DEM simulation of 1D compression test with crushing of particles: Relation between porosity and vertical stress for: (a) loose specimen (Dr=15%); and (b) medium dense specimen (Dr=68%).
Figure 7: Evolution of particle size distribution from the simulations of pumice sand using linear contact model.
CONCLUSIONS
In this paper, the discrete element method (DEM) was used to simulate single particle crushing test and 1D compression test on specimens consisting of crushable pumice sands in order to investigate the effect of accounting for particle crushing and the evolution of particle size distribution. The results of the simulations demonstrated a method for capturing the occurrence of particle crushing by taking into account the variations in strength of the particles with its size. The results showed that, by incorporating the strong dependency of crushing strength on the particle size, the behaviour of the specimen during 1D compression tests was well-simulated as this controlled the behaviour of particles. Significantly, it has been shown during the simulation that crushing of the particles, complemented by the use of linear contact model which rolling resistance incorporated, enabled a more realistic volumetric strain to be observed; that is, highly crushable granular materials exhibit overall contraction in DEM simulations. The overall results showed encouraging similarities with the reported physical behaviour of highly crushable pumice sand during 1D compression tests.
ACKNOWLEDGEMENTS
The authors wish to acknowledge the use of New Zealand eScience Infrastructure (NeSI) high-performance computing facilities, as well as for consulting support and/or training services as part of this research. New Zealand’s national facilities are provided by NeSI and funded jointly by NeSI’s collaborator institutions and through the Ministry of Business, Innovation & Employment’s Research Infrastructure programme (https://www.nesi.org.nz).
REFERENCES
Cheng, Y., Bolton, M., & Nakata, Y. 2004. Crushing and plastic deformation of soils simulated using DEM. Géotechnique, 54(2), 131-141.
Ciantia, M., Arroyo, M., Calvetti, F., & Gens, A. 2015. An approach to enhance efficiency of DEM modelling of soils with crushable grains. Géotechnique, 65(2), 91-110.
Ciantia, M. O., Arroyo, M., O’Sullivan, C., & Gens, A. 2019. Micromechanical inspection of incremental behaviour of crushable soils. Acta Geotechnica, 14(5), 1337-1356.
Cundall, P. A., & Strack, O. D. 1979. A discrete numerical model for granular assemblies. Géotechnique, 29(1), 47-65.
Fieldes, M. 1968. Soils of New Zealand, Part 2. New Zealand Soil Bureau Bulletin 26 (2).
Harireche, O., & McDowell, G. 2003. Discrete element modelling of cyclic loading of crushable aggreates. Granular Matter, 5(3), 147-151.
Iwashita, K. & Oda, M. 1998. Rolling resistance at contacts in simulation of shear band development by DEM. Journal of engineering mechanics, 124(3), 285–292.
McDowell, G., & Amon, A. 2000. The application of Weibull statistics to the fracture of soil particles. Soils and Foundations, 40(5), 133-141.
McDowell, G., & Harireche, O. 2002. Discrete element modelling of soil particle fracture. Géotechnique, 52(2), 131-135.
Orense, R., Pender, M., & O’Sullivan, A. 2012. Liquefaction characteristics of pumice sands. EQC Project Report 10/589, Earthquake Commission.
Orense, R. P., Pender, M., Hyodo, M., & Nakata, Y. 2013. Micro-mechanical properties of crushable pumice sands. Géotechnique Letters, 3(2), 67-71.
Robertson, D., & Bolton, M. 2001. DEM simulations of crushable grains and soils. Proceedings of the 4th International Conference on Micromechanics of Granular Media, Sendai, Japan, 623-626.
Russell, A. R., & Muir Wood, D. 2009. Point load tests and strength measurements for brittle spheres. International Journal of Rock Mechanics and Mining Sciences, 46(2), 272-280.
Šmilauer, V., Catalano, E., Chareyre, B., Dorofeenko, S., Duriez, J., Dyck, N., & Gladky, A. 2015. Yade Documentation 2nd ed.. The Yade Project. In: DOI.
Weibull, W. 1951. A statistical distribution function of wide applicability. Journal of Applied Mechanics, 18, 290-293.
Wesley, L., Meyer, V., Pranyoto, S., Pender, M., Larkin, T., & Duske, G. 1999. Engineering properties of a pumice sand. Proceedings of the 8th Australia New Zealand Conference on Geomechanics, 2, 901-908.