
ABSTRACT
This paper outlines the increasing importance of incorporating digital tools and initiatives into large scale infrastructure projects subject to complex ground conditions. The development and operation of large-scale iron ore mining operations in the Pilbara, Western Australia necessitated the upgrade of the wharf and jetty facility at Cape Lambert (CLA). The upgrades include replacement of dolphins at the wharf and strengthening of the existing jetty. Cape Lambert is located in the north-western part of the Pilbara Craton within Archaean granite-greenstone terrane.
Geotechnical investigation was undertaken by Aurecon and others to provide factual data to produce an engineering 3D ground model. Digital tools such as Leapfrog Works 3D geological modelling software were used to interpolate, analyse and communicate subsurface stratigraphy leading to the identification of key geotechnical risks. The effective communication of these risks and facilitation of multi-disciplinary collaboration early in the design process allowed for more confidence in pile design decision making and ultimately a large saving in costs incurred during construction for the client.
INTRODUCTION
Digital tools and initiatives are developing rapidly within geotechnical engineering including the implementation of 3D ground models. Growth in large scale infrastructure projects on more challenging ground conditions has increased the importance of developing detailed ground models to understand and communicate potential geo-hazards.
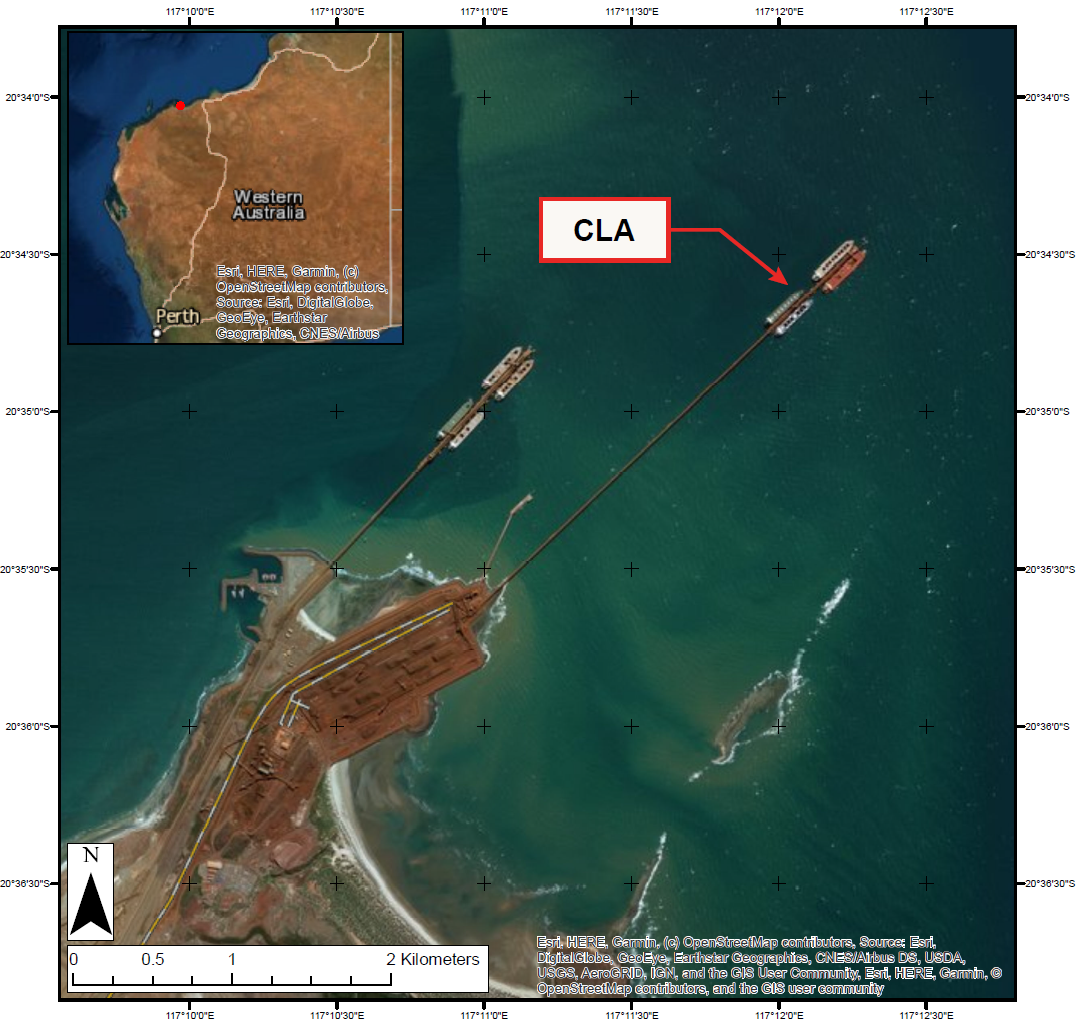 This paper presents a case study of geotechnical investigation and implementation of 3D ground modelling for the strengthening of jetty and wharf structures at Cape Lambert A port (CLA). The site is located at Port Walcott, approximately 40 kilometres north east of the regional centre of Karratha in the Pilbara region of Western Australia (Figure 1). The existing wharf and jetty structure were constructed between 1972 and 2002 and following recent structural integrity inspections, defects were identified. A risk assessment found that strengthening of the wharf and jetty structure were necessary to comply with safety and current Australian Standards requirements. New dolphin piles including driven steel raker piles both with and without grouted pin anchors are to be constructed at the wharf. Jetty strengthening entails the addition of two new bent raker piles per jetty segment bracing back to the main jetty. Geotechnical investigation was undertaken to gather information for the design of new dolphin piles and jetty stabilising bent piles.
Figure 1: Location of CLA wharf and jetty project
GEOLOGICAL SETTING
Cape Lambert is in the north-western margin of the Pilbara Craton. Hickman et al. (2000) further subdivided this region as an Archaean granite-greenstone terrane, now referred to as the West Pilbara Granite-Greenstone Terrane (WPGGT). The different tectono-stratigraphic domains, including the WPGGT, in the wider region of the site are presented in Figure 2.
The Roebourne 1:100,000 onshore geological map of the region published by the Geological Survey of Western Australia (Figure 2) illustrates that bedrock at the CLA site consists of both volcanic and metasedimentary geological units. Key ground features apparent along the wharf and jetty include:
- Shoreline rock platform in chert (east) and basalt (west) with shearing evident along the contact onshore. Basalt is inferred to be the Mount Roe Basalt (Afr); basalt with minor sandstone interbeds.
- Marine sediments onlap a coastal limestone reef exposed on the seabed inshore.
- An island / rock shoal composed of chert exists nearshore to the east of CLA along a north east trending fault line. Chert has been identified as Cleaverville Formation (Aci, Acf, Acw); banded-iron formation (BIF), chert and phyllite / shale beds.
- Basement geology, including metasediments and igneous rock types are collectively assigned to Regal Formation (Ab); porphyry and weathered basaltic rock.
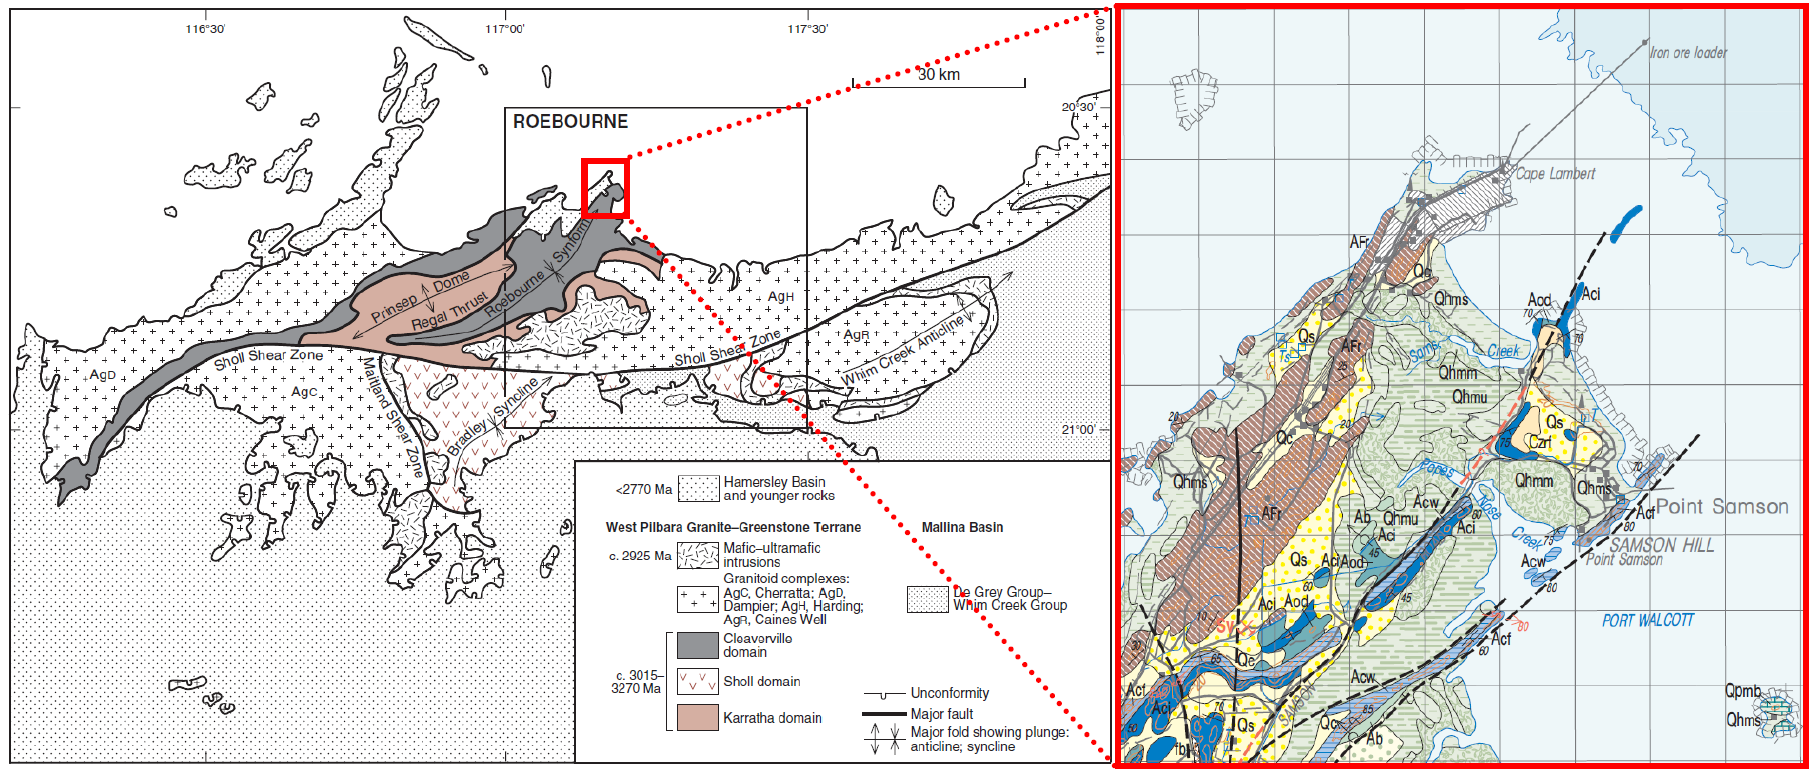
Figure 2: Tectono-stratigraphic domains of the West Pilbara Granite-Greenstone Terrane (Modified from Hickman, 2002 & Hickman, 2000)
GEOTECHNICAL INVESTIGATION
The need for a 3D geological model was driven by the project constraints and the need to communicate ground-borne risks to the client. Some key constraints included:
- Existing geotechnical information in the form of borehole data across the site was available but was limited due to depth of investigation at the wharf and scarcity of test locations along the jetty alignment.
- The port facilities are heavily utilised so the operational windows to undertake extensive intrusive borehole investigations was limited. Instead the investigation had to rely heavily on geophysical survey to develop ground interpretations between boreholes. These semi-continuous sections formed the basis of the 3D model.
- 2D models were not an effective tool for communications with the client to understand the spatial extent of an inferred fault structure mapped across the site.
Geophysical survey
Geophysical survey was selected as means of developing an inferred ground model in compliance with port operational constraints and to help plan future intrusive investigations. Two stages of geophysical survey were undertaken including a first stage along the wharf and second stage along the jetty.
Results summary
Geophysics provided an efficient and cost-effective means of collecting subsurface information. The primary benefit of utilising geophysical techniques was the ability to increase spatial sampling density so that background and inconsistent conditions could be identified early in the investigation. The first phase of geophysics identified two main anomalous features around CH2080 m and CH2200 m in the replacement dolphin area (Figure 3). At CH2080 m a low seismic velocity gradient zone is observed on the section and indicates less competent basement rock. In contrast at CH2200 m, a velocity inversion was identified above the basement rock, which indicates potential floaters or stronger material over weaker material. Boreholes, BH-A2 and BH-A3, were planned at these two locations to further investigate these anomalous velocity gradient changes as these locations also coincided with proposed new dolphin locations.
Geophysical surveys should not be intended to replace intrusive borehole investigations as the results can be representative of non-unique interpretation of ground conditions. However, with experience and in parallel with borehole data, they can aid in quickly and economically extending subsurface characterisation over large areas.
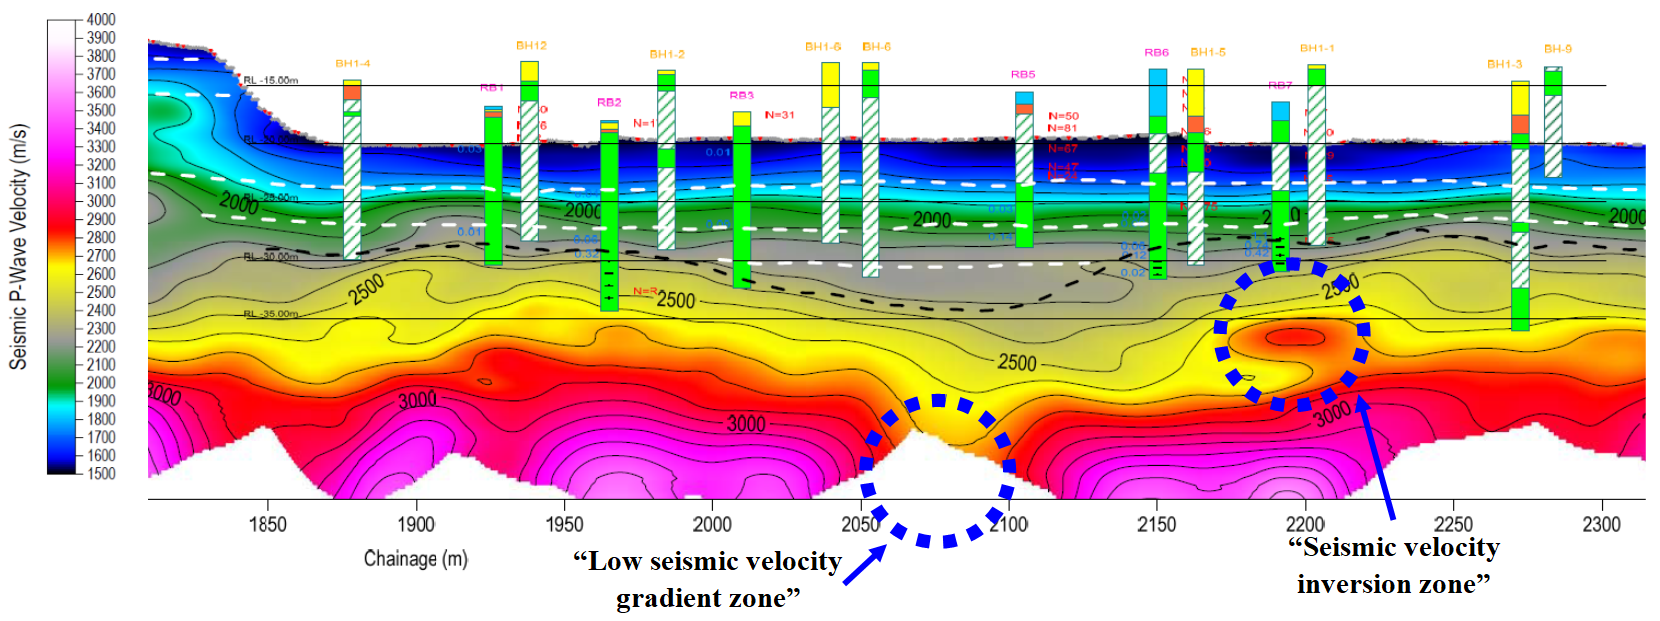
Figure 3. Interpreted seismic section line at wharf structure. Note that blue rings identify two main anomalous features with impacts on the proposed design.
Borehole investigation
Borehole investigations were limited to three boreholes along the wharf structure (BH-A1, BH-A2 and BH-A3). Due to disturbance of port operations, it was not feasible to drill at every dolphin or proposed jetty bracing structure. After the analysis of the first stage of geophysical results, borehole investigation locations were chosen at zones of uncertainty or inferred risk. Two boreholes were targeted at high compression wave velocity zones and one borehole was targeted at a zone of low compression wave velocity inferred to be less competent basement rock as identified previously.
Results summary
The results identified highly fractured extremely low to low strength basaltic rock in the identified zone of low compression wave velocity confirming a potential shear zone. The high compression wave velocity zones were identified by the drilling as more cemented anomalies in the profile. Along with identifying points of uncertainty in the geophysics results, borehole information was useful in calibrating the geophysics allowing identification of lateral changes in geology along the wharf and jetty alignment.
3D GROUND MODELLING
3D geological models are becoming increasingly more influential in engineering design. They are valued for their ability to communicate information about complex geological/geotechnical geometries and processes to a wide audience. By digesting technical information such as borehole logs, geophysics, laboratory data etc. into a 3D visualisation tool, it allows proportionate understanding of geological and engineering complexity to technical and non-technical parties involved.
Creating a 3D ground model
Many commercially available 3D geological modelling software packages now exist allowing the presentation of various sources of information in an efficient and more representative manner than traditional 2D methods. Seequents Leapfrog Works software was used to develop the 3D ground model for the wharf and jetty strengthening project. Leapfrog Works allows for fast and dynamic modelling of geological conditions on a 3D visualisation platform. It also allows the incorporation of engineering properties as well as the integration of 3D engineering designs from other software packages such as CAD. This was an integral step in this project allowing geological surfaces and zones of risks to be visualized in a centralised digital 3D environment.
Table 1 below provides a summary of all data inputs required in the model building process.
Table 1: Summary of data inputs for 3D ground model.
| Data | Description | Source | Use |
| Digital elevation contours | Elevation contours | Client geospatial database | Used to create 3D ground surface topography |
| Borehole data (historical) | 53 boreholes | Clough 1970, Dames & Moore 1982, Douglas Partners 1997, Halpern Glick Maunsell 2000, SKM/Coffey 2006 | Used to create 3D stratigraphy of geological units |
| Borehole data (recent) | 3 boreholes (BH-A1, BH-A2, BH-A3) | Aurecon 2017 | Used to create 3D stratigraphy of geological units |
| Geophysics | 7 survey lines | Marine & Earth Sciences 2017 & 2018 | Used to create 3D stratigraphy of geological units (cross referenced to borehole data) |
| Hydrographic survey | Seabed profiling to identify any piling obstacles | PH5 Hydrographic Services 2017 | Used to create 3D ground surface topography |
| Laser survey (LiDAR) | Point cloud data capture of existing structure | Veris 2018 | Used to geospatially truth structural model input |
| Client Site Context Capture (photogrammetry) | Photogrammetry model of onshore site area | Client 2018 | Used to visualize onshore geological trends and site geomorphology |
| As-built Tekla structural model | Structural wharf and jetty 3D model | Aurecon 2017 & 2018 | Used to show as-built structure in ground model |
Many different datasets were utilised in building and increasing the accuracy of the 3D ground model, all from different sources and in diverse file formats. These various file formats were simultaneously being developed during design requiring constant updating and data conversions. This prescribed the need for an efficient and user-friendly data conversion workflow which was developed using FME software. FME is a workflow conversion and automation software that can manipulate many different data formats within a convenient user interface. An example of how FME was used was the integration of the Tekla structural model with the Leapfrog geological model. A conversion pathway was required between the two models so that the structural design could be continually visualized in Leapfrog for purposes of geotechnical design and vice-versa in that the Leapfrog geological model mesh files could be visualized in Tekla all while both models were simultaneously updated. Both models were developed in alternate geographical coordinate systems. The Tekla model was developed in Robe River Grid (RRPG), which is a client site specific grid and the Leapfrog model was developed in Map Grid of Australia (MGA), which is a national grid. The Leapfrog model was produced in an alternate grid to the RRPG due to the format of the input files used to build the geological model. All site investigation data, including borehole location and geophysical survey data were all captured in MGA. Instead of converting the source input files of the geological model into RRPG and rebuilding the model, the MGA model itself was converted to RRPG simultaneously with data format conversion through the conversion workflow model developed in FME.
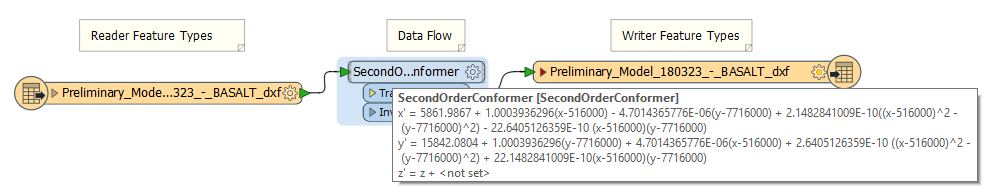
Figure 4: FME workflow for the conversion of “Basalt” DXF in MGA to RRPG.
Firstly, the geological model meshes were exported from Leapfrog as AutoCAD Drawing Exchange Format (DXF) files. These were then allocated as the reader feature types in the workflow. The transformer was then manually developed through a set of conversion coefficients specific to the conversion from MGA to RRPG. The writer feature type is also set as a DXF file type. When the workflow is run, the geospatial references of the geological meshes are converted depending on the set data flow coefficients. The geological meshes could then be visualised in Tekla for design verification. An example of the FME workflow is present in Figure 4 demonstrating the “Basalt” geological mesh being converted. The same workflow in reverse was used to convert the Tekla structural model into MGA for visualization in Leapfrog. Overall, the use of FME has allowed for simple multi-way conversion of data across different file formats and coordinate systems improving design clarity during the simultaneous model building process between disciplines.
Utilisation of the 3D ground model
3D ground modelling was fundamental in this project to identify and communicate geotechnical risk having an impact on decision making during pile design.
During early stages of geotechnical analysis, the conceptual ground model aided by illustrating the extent of historical site investigation data. The model was used to allocate zones of geotechnical risk and plan additional site investigations. Initial communications between geologists and engineers about uncertainty in the ground conditions relevant to the design was noticeably improved during this process.

Figure : Leapfrog 3D ground model (Identified shear zone alignment shown by red dashed line).
Once additional geotechnical investigations were undertaken, borehole results were input into the 3D model and geological surfaces adjusted appropriately. CMSR geophysics plots were georeferenced into the 3D model and stratigraphic contacts refined based on shear wave velocity results. Together with the conceptual model information, this information provided geological truthing along the wharf and jetty alignment. Risks established from the geotechnical investigation and analysis were then highlighted in the ground model and communicated to the design team allowing the necessary pile design changes to be implemented. Some key examples of this was the discovery of a not previously known shear zone aligned through the wharf structure (Figure 5) and identification of cemented anomalies in the geological profile. Identifying these features and communicating there risk visually from the outset allowed for design pile lengths to be refined accordingly. The requirement of pile rock socket anchoring could also be allocated with more certainty in the piling schedule. Through implementation of the Tekla structural model into the ground model (process described in Section 4.1) the final pile design could be easily verified. By further simplifying and constraining the model, through extracting geological meshes from the proposed dolphin and jetty bracing pile designs, the model unit interface levels and locations (x, y, z) were conveniently verified (Figure 6). Illustrating these risks in a 3D ground model environment allowed non-traditional users of ground models to be more immersed due to the visual methods of communication that it provided. Overall, the effective communication of these risks early in the design process allowed for more confidence in pile design decision making and subsequently a large saving in costs incurred during construction for the client.
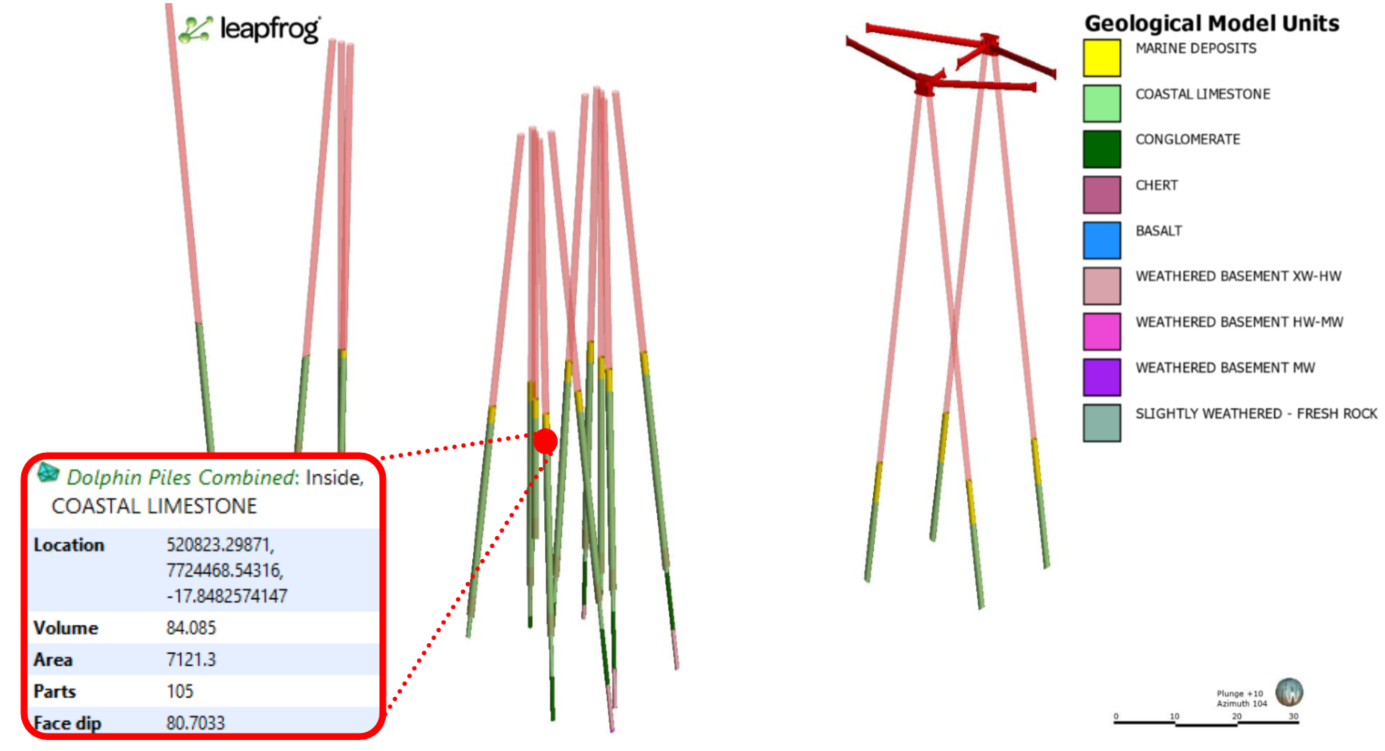
Figure : Proposed dolphin and jetty bracing pile geological meshes and associated point location meta-data.
VIRTUAL REALITY (VR)
The advancement in immersive and interactive technologies of recent has caused digital innovations such as VR to branch into the discipline of engineering. The advantage of 3D ground modelling for design purposes has been recognised, however with the incorporation of VR technologies the model can be a part of a useful client/stakeholder visualisation product (Rose et al., 2018). For the CLA project, a VR experience was developed of which incorporated the 3D ground model and many other datasets outlined in Table 1. The VR model was constructed in Unity which is a real-time 3D development platform for creating interactive virtual environments. The VR model allows the user to fly around in an immersive 3D space and view the proposed dolphin and jetty bracing pile designs in a scaled environment (Figure 7). The demonstration of this immersive experience allowed non-technical stakeholders involved to visualise and understand variations in ground conditions and how the associated geotechnical risks have impacted decision making relating to pile design and scheduling.
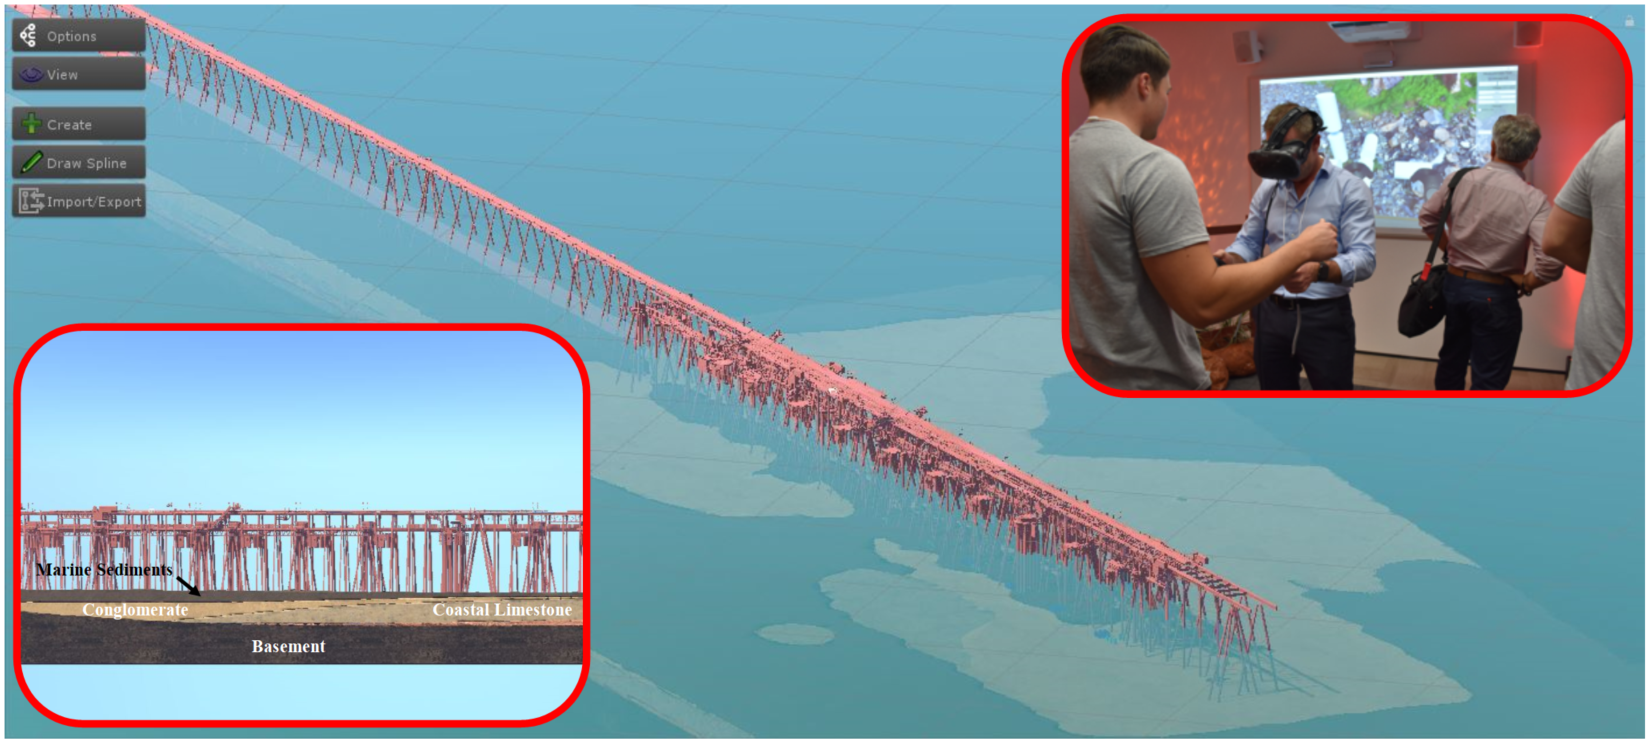
Figure 7: VR model of Cape Lambert A in Unity
CONCLUSION
The calibration of geophysics results with borehole data proved to be an effective way to characterise sub-surface ground conditions and ultimately lead to the development of a 3D ground model. Due to the variability in data formats that were required to build a ground model many challenges were encountered. With the use of other digital tools such as FME, datasets could be easily manipulated to assist in their consolidation.
In areas where the complexity of project or ground risk warrant it, 3D geology modelling represents current best practice in developing a common understanding of ground risk (Ireland et al. 2014). The generation of 3D ground models should be a fundamental aspect of any geotechnical project. In conceptual stages, they form the basis for determining methodology and effectiveness of the site investigation. The highly visual aspects of 3D models allow for the illustration of complex engineering geological data to specialist and non-specialist stakeholders. Early and clear communication of the ground complexities across the multiple design disciplines involved on the project resulted in early design modifications that resulted in millions of dollars in construction savings.
With the continuing development of digitals visualisation tools such as VR, communication of geotechnical ground risk and design solutions will become more in depth and highly immersive in the future.
REFERENCES
Hickman, A. H. 2000. Roebourne, W.A. Sheet 2356: Western Australia Geological Survey, 1:100,000 Geological Series
Hickman, A. H. 2002. Geology of the Roebourne 1:100 000 sheet: Western Australia Geological Survey, 1:100 000 Geological Series Explanatory Notes, 35p.
Hickman, A. H. Smithies, R. H., & Huston, D. L., 2000. Archaean geology of the West Pilbara Granite–Greenstone Terrane and Mallina Basin, Western Australia – a field guide: Western Australia Geological Survey, Record 2000/9, 61p.
Ireland, T., Spies, P., Eratne, S., & Newns, W. 2014. Risk Management and Use of a Geotechnical Baseline Report for a Competitive Alliance Procurement Process 15th Australian Tunneling Conference.
Rose, G., Kirk, P., Gibbons, C., & Lander, A. 2018. Three Dimensional Geological Models in Ground Engineering: When to use, how to build and review, benefits and potential pitfalls. Australian Geomechanics, Vol 53 (3).