Abstract
The recent update to the National Seismic Hazard Model has changed the approach to seismic site classification in New Zealand, with the time-averaged shear wave velocity over the top 30 m of the subsurface profile (VS30) at a site now being a key site classification metric. To provide robust estimates of VS30, the profession needs to have a good understanding of the advantages and limitations of the different geophysical site investigation methods that are used to define the shear wave velocity (VS) profiles needed to calculate VS30. The general characteristics and the constraints inherent to the methods themselves are discussed in this paper. The influence of the size of a site, topography across a site and the presence of existing infrastructure is summarised. The impact of the different geologic conditions on the choice of methods are highlighted. A relative comparison of costs associated with different methods is presented. Approaches to data interpretation for each method are discussed, including the translation of these into site classification metrics.
1 Introduction
The properties of the subsurface geologic profile at a site have been shown to have a significant influence on the ground motion characteristics, and amplification/de-amplification of ground motion intensities can be evaluated using methods of varying complexity. The properties of a site are often simplified down to various site classification metrics to represent potential seismic site amplification effects. Some common metrics include the time-averaged shear wave velocity over the top 30 metres of the subsurface profile (VS30), the fundamental site period (T0) and depth to layers with shear wave velocities of 1.0 km/s (Z1.0) and 2.5 km/s (Z2.5). These metrics can all be calculated based on the shear wave velocity (VS) profile of a site, representing the variation in VS with depth through different soil and rock layers.
Using a VS profile, the VS30 for a site can be calculated using:

(1)
where hi is the thickness of each soil/rock layer i between 0 and 30 m depth, and VS,i is the shear wave velocity of each layer i.
Using a VS profile, T0 can be estimated using the quarter wavelength method:
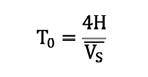
(2)

(3)
where H is the overall thickness of the profile above bedrock (equal to ) and is the time-averaged shear wave velocity of the profile above bedrock, based on the properties of all layers above this interface.
This approach provides a good approximation of T0 for simple profiles, however as the profile becomes more complex a more robust approach would be picking of the peaks associated with a 1D transfer function (representing the elastic site response effects). This can also be estimated directly using methods such as the horizontal-to-vertical spectral ratio (HVSR) method (Nogoshi & Igarashi 1971, Nakamura 1989, Molnar et al. 2018).
Z1.0 and Z2.5 can be defined directly from the site VS profile, however given that additional effort and resources may be required to profile to these depths, these are rarely measured and often simply assumed based on geologic setting.
Schematic representations of a soil site (Site A) and a rock site (Site B) are presented in Figure 1, demonstrating the depth ranges that are characterised by each of these site classification metrics. VS30 represents the upper 30 m of the geologic profile regardless of the profile characteristics. The depth range represented by Z1.0 and Z2.5 will vary from site to site and will be dependent on the local profile characteristics. As depicted in Figure 1, these metrics represent a deeper profile at Site A compared to Site B due to the presence of the soil profile above rock. As there is no soil present at Site B, T0 is equal to zero seconds, with this metric not capturing the properties of any of the profile. At Site A, T0 is representative of the soil profile properties above the bedrock interface.

Figure 1. Schematic cross-sectional view of site profiles and the depth ranges characterised by various site classification metrics.
The current New Zealand seismic design standard NZS1170-5:2004 (SNZ 2004) uses VS profiles, VS30 and T0 (alongside other geotechnical properties) to assign site subsoil classes (A-E). Seismic design codes internationally use site class frameworks that are based on VS30 and other geotechnical properties (CEN 2004, ASCE 2022). Most current ground motion models (GMMs) use VS30 as the main metric in site effect terms. The outputs of the recent update to the New Zealand National Seismic Hazard Model (Gerstenberger et al. 2022) were based on some of these GMMs, thus site effects were represented using VS30. The process of translating the updated New Zealand NSHM output into an updated NZS 1170.5 is in progress.
Historically, the use of in-situ seismic testing has been limited in geotechnical site characterisation in New Zealand outside of large infrastructure projects such as dams and pipelines. Following the 2010-2011 Canterbury earthquakes, increased awareness of the importance of site response and liquefaction hazard has resulted in greater demand for in-situ seismic testing throughout New Zealand. In turn, this has highlighted a lack of understanding of some important aspects associated with both collection and interpretation of seismic data amongst some contractors and engineers.
This paper presents some of the common site investigation methods used in New Zealand to develop a site VS profile and estimates of VS30. The focus is key aspects of each method, discussed across the methods themselves, the site characteristics, the characteristics of the geologic profile and the associated testing costs. It is important to note that the methods used to estimate VS30 discussed here would sit alongside the geotechnical investigation methods that are used to inform typical geotechnical design assessments (such as bearing capacity and settlement).
2 Site Investigation Methods
A summary of the steps required in the application of conventional geotechnical and seismic site classification methods that are used in New Zealand to obtain or estimate VS profiles is presented in Figure 2. These include invasive methods, invasive seismic methods and surface seismic methods. Conventional geotechnical invasive site investigation methods involve either the advancement of a probe into the ground by mechanical means using a string of rods or testing at depth intervals down a borehole. Invasive seismic methods also require the advancement of a probe or boreholes to place sensors (source and receiver(s)) for testing below the ground surface. Surface seismic methods, or non-invasive methods, do not require any sensors below the ground surface.
All methods require the robust acquisition of data, with seismic methods requiring data processing to support interpretation of the data collected. Some methods require the additional step of inversion, involving the use of modelling and rigorous interpretation to develop VS profiles. These are very useful methods, but to provide robust input into design and assessment the advantages and limitations of each should be acknowledged by the contractor and understood by the engineer.
The most common methods used in New Zealand to develop VS profiles and calculate VS30 are:
- Borehole methods: downhole (DH)
- Probe methods: seismic CPT (sCPT) and seismic DMT (sDMT)
- Surface wave methods: active and passive methods
The dashed lines in Figure 2 represent the use of correlations to define VS profiles from invasive methods, such as the cone penetrometer test (CPT), the standard penetration test (SPT), and the dilatometer test (DMT), meaning that direct seismic measurements are not taken. The use of correlations is not discussed further in this paper, with the applicability of existing correlations to New Zealand deposits and their associated uncertainty the focus of active research.
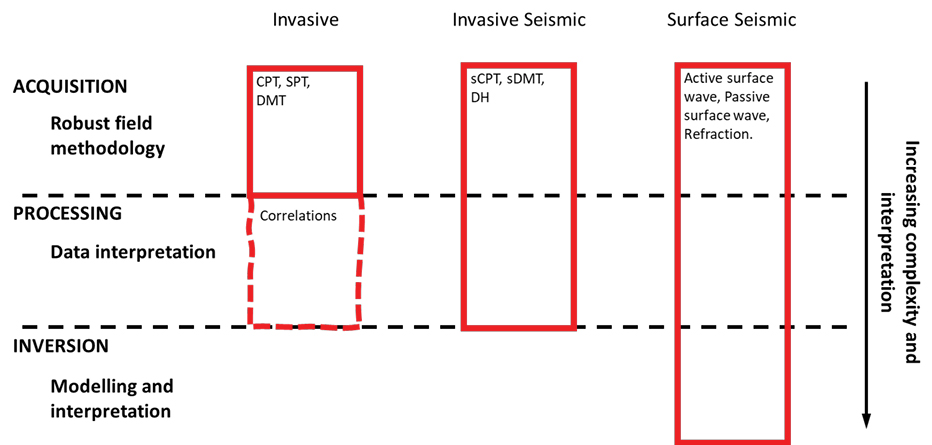
Figure 2. Summary of typical site investigation methods and the key steps involved in the application of each method. Some abbreviations are discussed in the body of the text.
3 Key Aspects and Typical Issues Across Seismic Methods
A detailed description of the seismic methods in Figure 2 and their key aspects are beyond the scope of this paper and are presented in detail in MBIE/NZGS Module 2 (2021) and Wentz (2019). Enough information should be provided in investigation reports to enable independent assessment of data quality, with suggested reporting requirements for these methods summarised in Wotherspoon et al. (2020) and the NZGS Ground Investigation Specification (2023).
The main potential issues with these methods can be grouped as follows:
- Incorrect field acquisition methodology
- Incorrect processing and inversion – a key issue for surface seismic methods
- Lack of understanding of the limitations of different methods
- Lack of any acknowledgement and quantification of the uncertainty of the methods
Some of the key points related to downhole and surface wave methods are described in following sub-sections.
3.1 Borehole and Probe Downhole Methods
Downhole methods (ASTM 2017, Wentz 2019, MBIE/NZGS 2021) are based on the propagation of body waves from a known source location at the ground surface to a sensor (or sensors) at different measurement depths. The sensor(s) are lowered into boreholes or directly pushed into the ground with a probe (e.g., sCPT or sDMT). Sources of various forms are used to create shear waves (S-waves), which can be recorded by sensors that measure vibration. The VS profile developed based on these methods is representative of the soil in a small zone surrounding the borehole/probe.
Some of the key aspects that can influence the quality of the outputs of these methods include:
- The success of borehole methods relies on good grouting between the borehole casing and surrounding soil, otherwise wave propagation will be poor.
- At each test depth, the orientation of the sensors(s) should be known, and multiple source impacts should also be used at each test depth. It can be difficult to interpret the testing data if this good practice is not followed, reducing confidence in the outputs.
It can be difficult to provide accurate estimates of VS in the top 3-5 m of the profile due to issues with the assumed wave propagation path.- Data from these methods can be processed using multiple approaches, allowing for an assessment of the uncertainty of the VS profile.
3.2 Surface Wave Methods
Surface wave methods are based on the propagation of surface waves that travel along the ground surface. These methods use sensors on the ground surface to record Rayleigh waves and Love waves, which are based on the measurement of vertical motion and horizontal motion respectively. The key aspect of surface wave methods is the dispersive nature of surface waves, meaning that different wavelengths (representative of different depth ranges in the subsurface profile) will travel at different velocities.
Rayleigh wave-based approaches are more commonly used as strong vertical ground motions are easier to create. However, in some geologic conditions (discussed in Section 5) Rayleigh wave measurements can be difficult to interpret. In these cases, it is good practice to supplement Raleigh wave surface wave testing with Love wave surface testing to provide robust constraint for analysis.
Methods can be active source, using a known noise source and a linear (1D) array of sensors, or passive source, using background noise sources and a 2D array of sensors. In New Zealand, the most used surface wave method is MASW or multi-channel analysis of surface waves (Park et al. 1999), an active source method. The VS profiles from these methods are an averaged representative of the soil properties beneath the line or array, and as such are influenced by a larger volume of soil than the invasive methods. Good practice guidance is summarised in MBIE/NZGS (2021) and Foti et al. (2017).
An experienced analyst is needed to process and interpret data to then inform the inversion stage of the analysis. Rather than providing a single, deterministic VS profile for each site, the inversion process should provide a suite of theoretical profiles that fit the experimental data well and allow for a measure of the uncertainty in the VS profile and VS30 to be reported.
2D active source surface wave methods, or 2D MASW, produces surface plots of the variation of VS with depth along a section. To develop the VS surface plots that represent this variability along the section, the single VS profiles from multiple 1D arrays are interpolated between the mid-point of each array location. The key issue with this method is that the suggested good practice approaches are typically not put into practice. 2D MASW lines are unlikely to be an appropriate method for constraining VS30 across a site as they will typically not be able to profile to 30 m depth because of the array lengths that are used.
Some of the key aspects that can influence the quality of the outputs of these methods include:
- The sensor array length used for active source testing needs to be approximately twice the depth of interest. The standard active source setup using a sledgehammer and 46 m sensor array (24 geophones at 2 m spacing) can characterise to approximately 15-20 m depth. A sensor array length of at least 60 m would be needed to characterise to 30 m depth.
- The use of multiple source offset distances off the end of the array is considered good practice, otherwise data collected may not be representative of the profile. This typically extends the total length required for active source testing by at least 20 m. Multiple source impacts should be used at each offset location.
- Data from active and passive surface wave methods can be combined to characterise the VS profile to depths of 30 m or greater. Passive source data should be collected using a 2D array of sensors (such as an L-shape or a circle), with the maximum depth that can be characterised equal to approximately half the distance between the two furthest apart sensors in the array. The use of 1D arrays for passive testing in isolation should be avoided as this method has been shown to be flawed in some conditions.
4 Potential Site Constraints
Site constraints are the limitations on space and accessibility at site of interest and how they can affect the choice of site investigation method(s). Some of the key constraints relate to:
- The dimensions and area of the site.
- The layout of the site and the presence of above and below ground structures/obstructions.
- The topography across the site.
- The equipment layout and rig placement.
Across all methods, the levels of background noise can be problematic as this can complicate the data interpretation. To combat this, testing could be carried out when other activities on site have ceased or during the evening/night where activities surrounding the site have reduced. Other strategies to deal with noise are described in the previous section.
Borehole and probe methods require access for rigs and the site needs to be stable enough to support the rig (settlement or slope stability). Topography across the site may cause issues for site access and investigations, meaning a working platform may be required. A flat ground surface is an underlying assumption of most common surface wave data processing and inversion methods, however, allowable variation in elevation is dependent on the size of the array and the sensor locations. Testing can be carried out across a slope if the topography is relatively flat along the array location, however a 2D array would not be appropriate in these conditions.
Schematic examples of plan views of different sites with different investigation layouts are presented in Figure 3.

Figure 3 Schematic examples of different site characteristics and the potential locations and layout of different types of investigations: a) greenfield sites; b) sites with structure already present on large site; c) constrained site in urban area surrounded by footpath and roadways.
Figure 3a represents a greenfield site or a site where no obstructions are present. Borehole and probe methods are unlikely to have any significant constraints at these sites. As described previously, multiple surface wave methods using 1D and 2D arrays are needed, and the dimensions of these need to fit within the site. Examples using a circular array and an L-array are shown.
Figure 3b represents a site where space is available around any buildings or structures that are present. Borehole and probe methods would again have few constraints, barring limited site access and the presence of underground utilities. However, borehole methods may be constrained due to the noise or disturbance created. Surface wave methods can be used near or around structures, with an example layout shown using an L-array and a circular array. If there are below-ground structures, the layout of surface wave instrumentation would need to account for these.
As these methods rely on surface wave propagation, they can be affected by solid below-ground structures (basements, deep foundations) or voids. Active source surface wave testing lines should be set back away from underground structures at a distance at least equal to the depth of the structures. Surface wave testing can cope with the presence of near-surface pipes and utilities crossing the array, although these should be avoided when undertaking active source testing. Passive arrays will be affected if there is wave propagation across the array that travels through any underground structures, so placing the instruments around a buried structure should be avoided.
Figure 3c represents a site where a structure takes up most or all of the site plan, a situation that may be encountered in a built-up urban area. Here all methods will have more constraints to deal with. Borehole and probe methods may have to undertake testing in public land adjacent to the site, requiring traffic management. Some probe methods may be able to undertake testing through foundation slabs if the rig is small enough, although this may restrict the maximum depth of investigation. Surface wave methods face the same constraints described in the previous paragraphs. However, as no large rigs are used, these methods could be undertaken on the footpath, reducing some of the traffic management requirements.
For all methods, testing could be performed in an adjacent site if there was no space available. Here there would need to be some level of confidence that the was no significant subsurface lateral variability between the sites.
5 Potential Geologic Constraints
Geologic constraints relate to the characteristics of the geologic profile and the presence of different deposits and layering characteristics of these deposits.
Schematic examples of different general geologic profiles are presented in Figure 4. Here softer soils and stiffer soils are used in a general sense, reflecting the relative characteristics of each layer. Each schematic can be assumed to represent a profile depth of 30 m for the purposes of classifying VS30. The applicability of different site investigation methods for each profile in Figure 4 are summarised in Table 1 and in more detail below:
- Borehole methods could be used in any of the profiles shown.
- Any method could be used in the Figure 4a profile.
- Probe methods may not be able to push through the stiffer soil layer in Figure 4b, with this dependent on soil type and rig capacity. Local geologic knowledge and experience would be required to understand whether probe methods would be successful. Surface wave methods could be used in the Figure 4b profile. If the surface layer is much softer than the underlying layer and relatively thin, both a Rayleigh and Love wave-based approach should be used to help inform the interpretation.
- Surface wave methods could be used in the Figure 4c profile, while probe methods could not characterise below the rock surface. Surface wave methods would be improved using the combined Rayleigh and Love wave-based approach described in the previous bullet point.
- Probe methods could be used in the Figure 4d profile until the stiffer layers prevent the advancement of the probe. These layers could be penetrated to continue the advancement of probes in the softer soil layers (using a dummy cone or dynamic cone); however, this would mean VS measurements would be difficult to obtain in the stiffer layers. Surface wave methods could be used in this profile, again with the combined Rayleigh and Love wave-based approach potentially beneficial. The VS of each layer could be difficult to constrain given that VS would increase and decrease from one layer to the next. Surface wave methods would still be able to provide robust VS30 estimates as the method can provide an averaged representation of the profile characteristics.
- Probe methods could be used in the Figure 4e profile unless the stiffer layers prevent the advancement of the probe. Surface wave methods could also be used.
- Probe methods could not be used in the Figure 4f profile. Surface wave methods could be used and again a Love wave-based approach would be useful to include. Shear wave refraction, another surface seismic method not discussed herein, could also be used to characterise rock deposits. One of the key constraints of this method is that the length of the array needs to be 4-5 times the target depth.
- If there is uncertainty about the profile characteristics that are likely to be encountered, there may be a need to mix methods or have multiple methods available. Otherwise, the VS profile that can be defined may be shallower than the target depth (30 m for VS30).
- The variability in the geologic conditions across the site will also dictate the number of test locations required to appropriately characterise the site parameters. This will be influenced by the lateral extent of the construction project and the importance of the project. Geotechnical investigations undertaken alongside seismic investigations will help better understand this variability. Unless there is an abrupt change in the elevation of soil/rock interfaces where a significant change in VS is present (such as at the bedrock interface), the variability of VS30 across most “typical” small sites will not be significant.
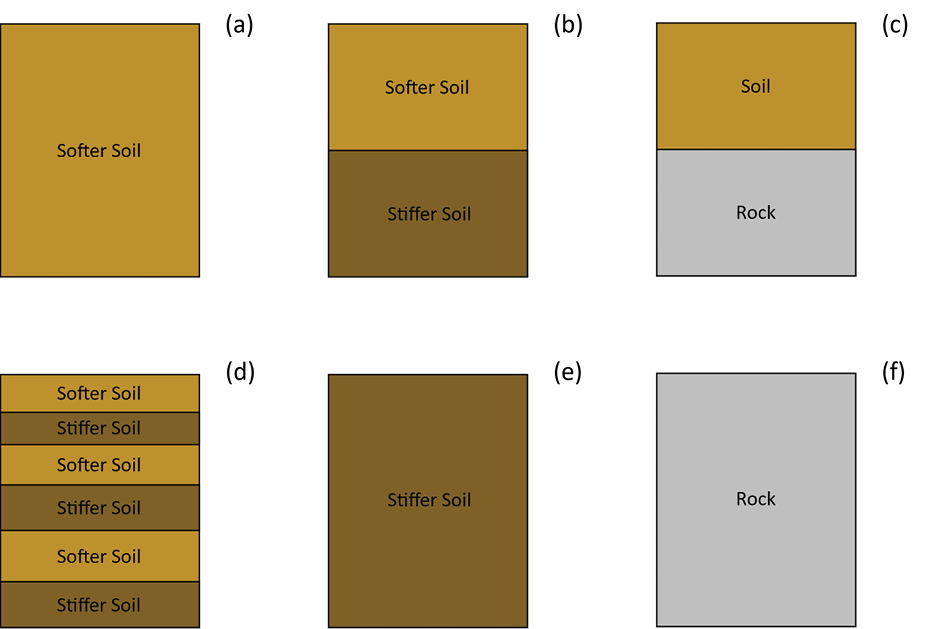
Figure 4 Simplified representations of general geologic profile characteristics that may be encountered: a) soft soils; b) soft soils overlying stiffer soils; c) soils overlying rock; d) interlayered profile of soft and stiff soils; e) stiff soils; f) rock.

6 Relative Costs Across Seismic Methods
The time and costs associated with key tasks required to define VS30 across different methods are summarised below. Note that these details relate to a single test location at a site.
For data acquisition:
- Borehole methods require the mobilisation of a drill rig. The time required to drill and case a single borehole will depend on the type of rig and the characteristics of the subsurface profile, and this could range from one to three days. In many cases the personnel doing the downhole seismic testing will not be those doing the drilling.
- Probe methods require the mobilisation of a rig. A single probe-based investigation could be completed in a few hours. If a stiff soil/rock layer is encountered, hammering or drilling through the stiff layer maybe required; resulting in increased time and cost.
- Surface seismic methods do not require a rig and single testing location can be completed in a few hours.
For data processing:
- For both borehole and probe methods, interpretation is required to define VS profiles. A single testing location can be completed in a few hours or less.
- For surface wave methods, interpretation is required to process and pick the appropriate dispersion data. This can be completed in a few hours or less for a single testing location.
For inversion:
- Inversion is required for surface wave methods to define VS profiles. This can take up to half a day for a single testing location depending on the complexity of the site and the resolution of the VS profiles.
- If done appropriately, the interpretation and inversion of surface wave data will take more time than the field acquisition. Borehole methods have the most costs associated with the duration of the acquisition phase, while surface wave methods will have the most costs associated with the processing and inversion time. Probe methods are likely to be the lowest overall cost across all the methods.
- If testing is required on the street as shown in Figure 3c, traffic will be interrupted for the duration of the testing, adding traffic management costs to the overall budget.
- After the shear wave velocity profile has been defined, the calculation of VS30 is routine and should not add little if any additional cost.
8 Summary
This paper has summarised the most common seismic site investigation methods used to define VS profiles and shear wave velocity-based seismic site classification metrics, and in particular VS30. Some of the key constraints across methods, sites, geology, and cost have been described. To provide robust estimates of VS30 the constraints of each method should be well understood, the investigations scoped accordingly, and the data processing and inversion should be rigorously performed by an experienced analyst. Local geotechnical/geologic knowledge is critical and geotechnical site investigation data should be reviewed where available.
To support well-informed seismic design, the industry should set a high standard and contractors and consultants should work together. End users of seismic investigation data should develop a good understanding of the uses and limitations of the various methods and insist on high quality data collection, processing and inversion – including an estimate of potential uncertainty. This supports both industry and the advancement of site classification and seismic hazard research. To assess data quality, enough information should be reported to be able to follow the logic and interpretation applied. These expectations are summarised in the NZGS Ground Investigation Specification (2023).
9 Acknowledgements
The authors would like to acknowledge the support of the following funders that have supported a range of site characterisation related efforts: Toka Tū Ake EQC, Te Hiranga Rū QuakeCoRE, Quake Centre and University of Auckland.
10 References
ASTM International (2017). ASTM D7400-17 Standard Test Methods for Downhole Seismic Testing, ASTM International, West Conshohocken, PA, USA.
American Society of Civil Engineers (2021). Minimum design loads and associated criteria for buildings and other structures, ASCE/SEI 7-22, Virginia, USA, American Society of Civil Engineers.
European Committee for Standardization (CEN) (2004). Eurocode 8: Design of structures for earthquake resistance – Part 1: General rules, seismic actions and rules for buildings, Brussels (BE): European Committee for Standardization. 229 p.
Foti S, Hollender F, Garofalo F, Albarello D, Asten M, Bard PY, et al. (2017). Guidelines for the good practice of surface wave analysis: a product of the InterPACIFIC project, Bulletin of Earthquake Engineering, 16: 2367–2420.
Gerstenberger MC, Bora S, Bradley BA, DiCaprio C, Van Dissen RJ, Atkinson GM, Chamberlain C, Christophersen A, Clark KJ, Coffey GL, et al. (2022). New Zealand National Seismic Hazard Model 2022 revision: model, hazard and process overview, Lower Hutt (NZ): GNS Science. 106 p. (GNS Science report; 2022/57). doi:10.21420/TB83-7X19.
Molnar S, Cassidy JF, Castellaro S, Cornou C, Crow H, Hunter JA, Matsushima S, Sánchez-Sesma FJ & Yong A (2018). Application of microtremor horizontal-to-vertical spectral ratio (MHVSR) analysis for site characterization: State of the art, Surveys in Geophysics, 39(4): 613-631.
Nakamura Y (1989). A method for dynamic characteristics estimation of subsurface using microtremor on the ground surface, QR of RTRI, 30(1), 25-33.
Nogoshi M & Igarashi T (1970). On the propagation characteristics estimations of subsurface using microtremors on the ground surface, Japanese Seismological Society, (23), 264-280.
NZGS (2023). New Zealand Ground Investigation Specification, NZGS, Draft available at: https://www.nzgs.org/nzgs-earthworks-ground-investigation-specifications/.
NZGS/MBIE (2021). Earthquake geotechnical engineering practice: Module 2. Geotechnical investigations for earthquake engineering, NZGS/MBIE, Wellington.
Standards New Zealand (SNZ) (2004). NZS1170.5 Structural Design Actions. Part 5: Earthquake Actions – New Zealand, Standards New Zealand, Wellington.
Wentz R (2019). Invasive seismic testing: A summary of methods and good practice, Quake Centre Report, Christchurch.
Wotherspoon LM, Wentz R, Cox BR & Stolte AC (2020). Assessing the quality and uncertainty of in-situ seismic investigation methods, NZGS Symposium 2020, 15-17 October, Dunedin, New Zealand.


