Case study at Muriwai following Cyclone Gabrielle, 2023
Abstract
Cyclone Gabrielle made landfall in Auckland on the 14 February 2023 and caused significant damage across the region, and in particular to the west coast settlement of Muriwai. Numerous large, rapidly-moving debris flows resulted from the initiation of landslides along the extremely weak, 150 m-long, up to 80 m-high sandstone escarpment. Many houses were destroyed and two firefighters were killed. A similar event in 1965 saw holiday homes destroyed and two fatalities due to storm-related debris flows. In the short-term Auckland Council used an empirical assessment of debris flow travel distance to inform the emergency response. GHD were engaged to provide a detailed, quantitative loss-of-life risk assessment to inform Auckland Council’s buy-out programme, whereby owner’s homes in ‘intolerable’ risk areas could be purchased and the land retired. The basis for the work was to link the observed size, frequency and extent of landslides and model the likelihood of similarly damaging future events. RAMMS debris flow simulations were key to this work and the risk calculations estimated that an occupant of a dwelling could be harmed or killed where debris flows were greater than 0.5 m deep. The damaging effects of large, entrained trees was also considered.
1. Introduction
1.1 Cyclone Gabrielle
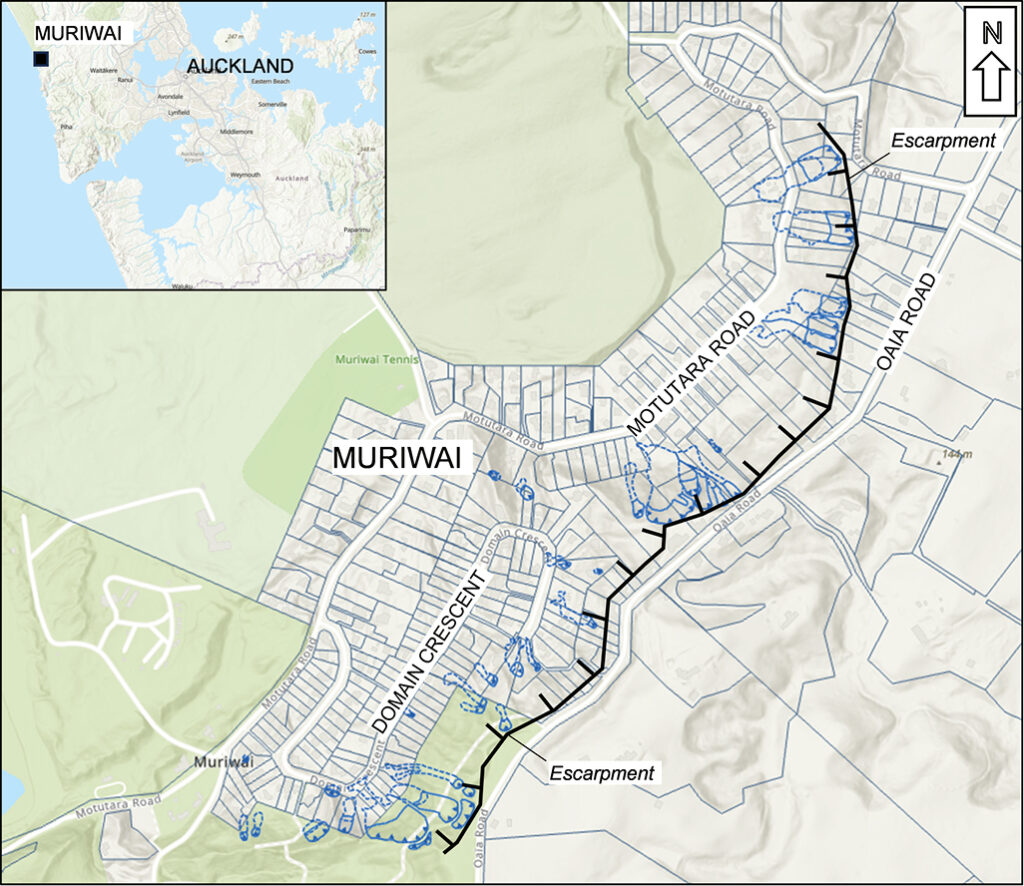
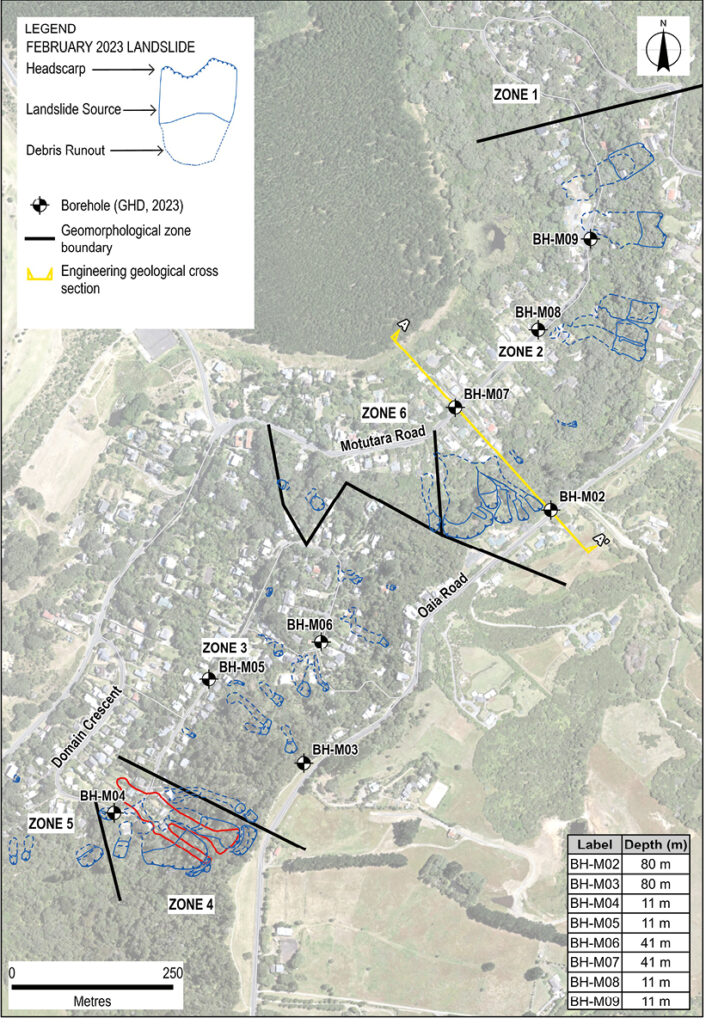
Cyclone Gabrielle caused widespread flood and slope damage to the northern and eastern areas of New Zealand in February 2023. A National State of Emergency was declared on 14 February 2023, when the worst impacts started to be experienced. This extended an existing local state of emergency already declared in Auckland as a result of the Auckland Anniversary Day flooding on 27 January 2023. Some of the most extreme impacts of Cyclone Gabrielle in Auckland were experienced by the small coastal settlement of Muriwai, which is located in the Waitakere area approximately 40\km west of Auckland (see Figure 1). The notable feature of the area is an up to 80\m-high, 1.5 km-long, northeast-southwest oriented escarpment located to the east of the main residential area (see Figure 2A).
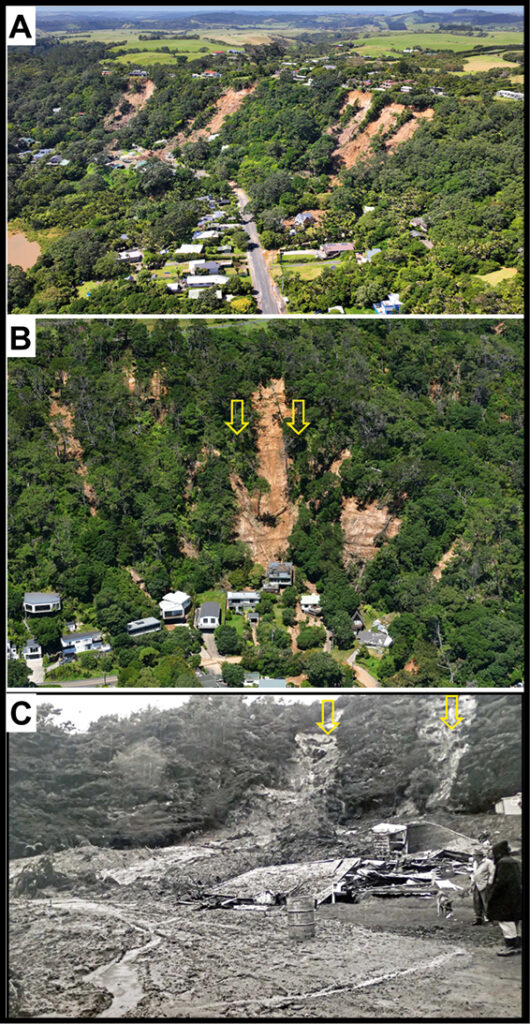
The community was in the process of self-evacuating when multiple landslides initiated from the escarpment that developed into saturated debris flows, causing damage to many buildings and infrastructure (see Figure 2B). Tragically, the deaths of two volunteer firefighters resulted from debris flow that destroyed residential buildings. Tens of dwellings were damaged or destroyed by debris flow impact, while many more were exposed to risks from the newly formed landslides. Landslides often contained large trees that were particularly destructive.
Muriwai had historically experienced similar devastating landslides. In 1965 two fatalities occurred when landslides impacted two residential properties on Domain Crescent at the base of the escarpment (see Figure 2C). Two other occupants were also in the affected buildings, but fortunately were rescued (Hayward, 2022).
1.2 Emergency response
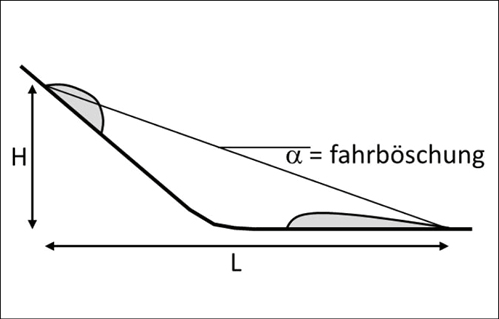
An emergency assessment of dwellings was undertaken by Auckland Council geotechnical personnel during and following the event to identify properties requiring immediate evacuation using the Rapid Building Assessment (RBA) process. 201 properties were given red placards, denoting unsuitability for occupancy due to a geotechnical hazard, and a further 118 were given yellow placards limiting access, typically to daylight hours only when evacuation can be more easily achieved. This was partly informed by a “fahrböschung” angle (F-angle) assessment using the approach outlined in Mitchell and McDougall (2019) that uses empirical landslide data to estimate the travel distance of a flowing landslide according to basic slope cross-sectional geometry (see Figure 3). The benefit of this approach is that a large area can be characterized quickly based on relatively minimal information – the assessment in this case taking only days to complete. It calculated an F-angle of 22° to 25° from the top of the escarpment.
Above the escarpment, red placards were applied to tens of dwellings that were located on the west side of Oaia Road due to the possibility of slope regression undermining buildings at the crest of failed slopes.
1.3 Project scope
Following the emergency response, Auckland Council moved from short-term management of the immediate hazard to a long-term consideration of the suitability of Muriwai for ongoing habitation. In April 2023 GHD was engaged to provide a robust landslide loss-of-life risk assessment to residents of existing dwellings. The focus for the study was large-scale landslides originating from the escarpment located to the south-east Muriwai. A nominal volume of greater than approximately 50\m3 was selected as minimum size criteria to guide the study as landslides of that scale were shown to have the potential to cause total or partial collapse of a dwelling and therefore cause significant risk to the occupants. Smaller slope failures commonly occurred during Cyclone Gabrielle, but these generally posed a smaller risk to people.
The purpose of the risk assessment was to undertake a quantitative landslide risk assessment (QRA) to estimate the risk of loss of life posed by large-scale landslides to individuals in dwellings at Muriwai. This was informed by the following:
- Engineering geological mapping of large landslides and a geotechnical investigation involving rotary cored boreholes and groundwater monitoring installations.
- Desktop analysis of remote data (LiDAR surveys), review of historical aerial photographs, historical landslide records, slope stability analysis.
- Three-dimensional computer debris flow simulation.
These data were used to inform the QRA for consideration by Auckland Council for homeowner negotiations regarding future occupancy.
2. Engineering geology of Muriwai
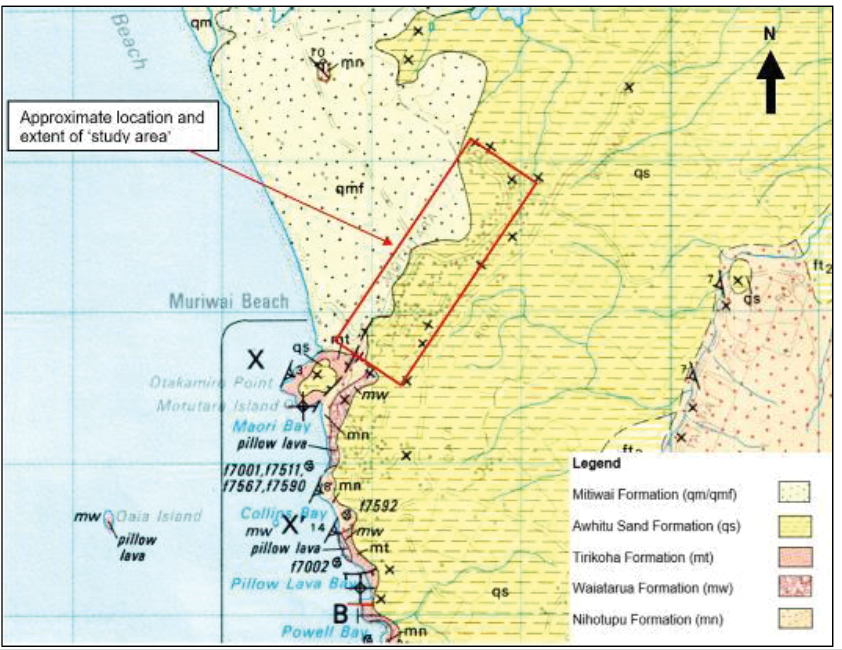
The Muriwai escarpment is underlain by Pleistocene-age Awhitu Sand Formation of the Kaihu Group, comprising coarse sand, clayey, often limonitised (iron cemented), with minor tuff, lignite and siltstone (see Figure 4; Hayward, 1983). Unconformably underlying this is Miocene-age volcanic and volcaniclastic deposits of the Waitakere Group, namely the Tirikoha, Waiatarua and Nihotupu Formations. Modern beach sand forms the dunes system between Muriwai and the modern-day coastline.
From the late Miocene to Pleistocene, the geological history of the study area has been subject to repeating cycles of deposition, erosion, uplift and further down-wearing of the Waitakere Group volcanic deposits (Hayward, 1979). The Awhitu Sand Formation experienced similar uplift and down-wearing cycles. The uplift occurred on a series of northeast-oriented faults forming ‘blocks’ of land that are upthrown and downthrown relative to each other (Hayward, 1976). This process has also resulted in a shallow (10-15°) dip to the northeast along the unconformity.
The topography of the site is dominated by the 150 m-long Awhitu Sand Formation escarpment. It can be broadly divided into a northern portion that is up to 80 m high and has a well-defined, steep face that slopes at approximately 30 degrees, intersecting at the crest with a horizontal platform (Oaia Road is located on this platform). The southern portion is relatively less well defined, with a more gradual transition between the horizontal platform and sloping ground to the northwest. The escarpment face slope is variable but is less than 50 m high. It is mostly covered with dense bushes and large trees, including native species and pine trees.
The platform above the escarpment slopes gently to the east and is incised with channels that drain water through a network of channels that eventually converge into Okiritoto Stream, discharging westward towards the coast some 2 km north of Muriwai.
Land use within the site includes residential, isolated light commercial, recreational public land (beach frontage, regional park, and sand dunes), and private land (forestry and golf course).
Data made available to GHD by Auckland Council included pre- and post-Cyclone Gabrielle processed LiDAR-based elevation data at 1 m point spacing (processed from data collected at >50 ppsm) with buildings and vegetation removed. Corresponding spatially corrected aerial imagery was obtained from LINZ and Auckland Council and was used to create various surface images to assist with geomorphological interpretation.
Large landslides associated with Cyclone Gabrielle were identified remotely from aerial imagery, with field inspections following to record further detail. A register of mapped landslides was developed that included location, dimensions, slope geometry and the interpreted landslide source and runout distance. Approximately 35 landslides were recorded, the largest being 77 m wide and 154 m long uphill of Motutara Road. Observations of headscarps and comparison of pre- and post-event topography indicates that average landslide depth is approximately 0.5 m but may be locally up to 2 m deep, with volumes suspected to be less than 5,000 m3, placing them into size classes 4 and smaller (IAEG 2022).
Exposure of the escarpment geology was observed in the large landslide scars as well as in exposure on Edwin Mitchelson Track that traverses the escarpment southwards from Oaia Road (see Figure 5), commencing at the location of BH-M03.

The Awhitu Sand Formation can broadly be described as a slightly to moderately weathered, orange, yellow and white, massive to thickly bedded sandstone that is extremely weak to weak. Beds are non-continuous, sub-horizontal and dip slightly to the north. Cross-bedding is observed in steep exposures consistent with their coastal dune origin and are highlighted by red iron-staining. There are occasional non-continuous laminated to thick layers and lenses of silt, clay and peat. There are occasional tight, vertical joints.
The upper several tens of metres of Awhitu Sand Formation are relatively less iron cemented and therefore weaker, with typical SPT N-values of less than 20 and a UCS of less than 1 MPa. Below this is stronger material with greater iron cementation, where N-values of more than 50 are recorded and the UCS is between 1 and 2 MPa (see Figure 8A).
The surficial layer at the toe of the escarpment comprises disrupted colluvium containing loose sand Awhitu derivatives as well as clayey silt and buried organics consistent with landslide debris. Intact blocks of sandstone of more than 1 m were encountered, which were interpreted to be transported. This layer was between 7.5 m and 38 m but could not necessarily be connected laterally between boreholes. Alluvial deposits of a similar nature were also observed, signalling a possibly complex interaction of active processes.
Groundwater in boreholes was manually measured in boreholes after installation, and telemetered water level loggers were installed to inform decision-making. Results from April 2024 are presented here to give an indication of typical conditions once the effects of Cyclone Gabrielle had passed (see Table 1). The water level in escarpment boreholes was more than 50 m bgl and below the escarpment was between 7 m and 19 m bgl. Telemetered water level data are not presented here.
Table 1: Rotary cored borehole geotechnical investigation summary undertaken by GHD in 2023. Measurements rounded to nearest metre. See Figure 6 for location.
| Borehole | Location | Drilled depth from surface | Collar reduced level (RL) | Piezometer screen depth (below ground) | Groundwater depth April 2024 (below ground) |
| BH-M01 | Oaia Road | 80 m | 138 m | 73-79 m | 51 m |
| BH-M02 | 80 m | 144 m | 60-66 m | 60 m | |
| BH-M03 | 80 m | 150 m | 73-79 m | Dry | |
| BH-M04 | Domain Crescent | 11 m | 53 m | No installation | – |
| BH-M05 | 11 m | 63 m | No installation | – | |
| BH-M06 | 41 m | 90 m | 21-27 m | 19 m | |
| BH-M07 | Motutara Road | 41 m | 52 m | 33-39 m | 7 m |
| BH-M08 | 11 m | 63 m | No installation | – | |
| BH-M09 | 11 m | 72 m | 7-10 m | 7 m |
Rain falling west of the escarpment crest enters the catchment area that discharges to the lower slopes in Muriwai. Rainfall to the east is directed away from the escarpment towards and beyond Oaia Road. Speculation that stormwater from dwellings on Oaia Road may have significantly contributed to escarpment instability appears to be unfounded following an audit of private reticulation and roadside drainage at that location.
Surface seepage has been observed in the lower portion of the escarpment slope in properties in Domain Crescent and in newly exposed landslide slip surfaces. Springs are well known in this area and were reported by residents as being a feature of the area with relatively consistent flows. The groundwater regime is not fully understood and may be influenced by locally perched aquifers of uncertain extent. No voids indicating tunnel gullies were observed in the exposed Awhitu Sand Formation slopes.
From the data available, including continuous groundwater monitoring established after the 2023 event, it is inferred that surface water flow and infiltration/saturation of shallow soils were likely to be the primary triggers of landslides.
3. Antecedent conditions
The rainfall prior to, and during, Cyclone Gabrielle was a primary trigger of regional slope instability. January 2023 was Auckland’s wettest month since records began, with the National Institute of Water and Atmospheric Research (NIWA) describing the peak storm rainfall of 539 mm at Albert Park in Auckland on 27 January as being at least a 1-in-200-year event (NIWA, 2023). Over 140,000 recorded landslides were triggered by these events across the North Island of New Zealand (GNS, 2023) of which approximately 50,000 were in the Auckland Region.
Measurements of rainfall at Muriwai were unfortunately not obtained due to storm damage of the tipping bucket rain gauge. Estimates of rainfall recurrence interval by the Auckland Council meteorologist relied mainly on the Quantitative Precipitation Estimate (QPE) Rain Radar System and calculated that Cyclone Gabrielle at Muriwai was greater than a 1 in 100-year annual recurrence interval for the 12-hour duration rainfall, with speculation that it could possibly be up to a 1 in 250-year event (Auckland Council internal memo, 2023).
Similarly, accurate rainfall data is not available for the storms that preceded 1965 landslide for comparison – Hayward (2022) reports 95 mm occurred two days prior to the landslide and 45 mm fell in the 12 hours before the landslides occurred on 27 August.

4. Characterisation of landslide hazard

We present a model for landsliding where during the storm event, movement initiates on a super-saturated Awhitu Sand Formation slope that is weakened by surficial weathering, possibly exacerbated and loosened by tree-root penetration to 1 to 2 m depth (see Figure 8B). The extent to which tree-root effects stabilise the slope or destabilise the slope has not been able to be quantified.
Initial movement may be due to toppling on steep faces, or translation on flatter slopes, however on rupture, the extremely weak rock rapidly disintegrates into a sandy debris matrix forming debris flows that travel rapidly downslope. Alternatively, springs lower down the slope may cause small initial failures that regress further upslope, with a similar result. The input of groundwater in this scenario is not known, but it is expected that antecedent conditions contribute.
A simplified back analysis of the escarpment failure using two-dimensional limit equilibrium software (SlopeW) estimated the Awhitu Sand Formation as having an effective cohesion (c’) of 21 kPa and an angle of internal friction (Φ’) of 39°.
The topography below the escarpment is typically not deeply incised by existing erosion or stream channels, with the result that channelising of debris is relatively minimal. In addition, the absence of rock or boulders means that evidence of deep scour does not occur. Surface relief did influence landslide pathways, with some debris flows coalescing and in confined areas. Consequently, the location and degree of damage to residential properties is variable along Domain Crescent and Motutara Road. Entrainment of large trees did occur in many landslides in Muriwai in February 2023, where they added to the destructive power of the debris flow.
As a comparison to the Auckland Council’s F-angle debris flow travel distance estimation, we independently used more recent data of 32 landslides, which revealed a wide F-angle range of 16° to 42°, likely attributable to the effects of local topography, degree of channelisation and potentially obstacles such as vegetation and built structures. This review of F-angles at Muriwai suggests that while it is a useful rapid screening method for landslide runout prediction, the range in the data makes it difficult for this method to be used in isolation except for rapid decision-making.
We also used the Hunter & Fell (2002) method for “rapid” landslides, where the travel distance angle of the failed slide mass is calculated from assessment of the failure mechanics of the initial slide (judged to be dilative on shearing due to the sandy composition of failure debris), the type of slope, slide volume, geometry of the slope at and below the slide source area, and the degree of confinement of the travel path of the landslide. Comparison of this method with the known F-angles typically found agreement within a few degrees and travel distance estimations are consistent with each assessment method. It was concluded that future landslides are unlikely to travel appreciably further than the observed February 2023 runout distances.
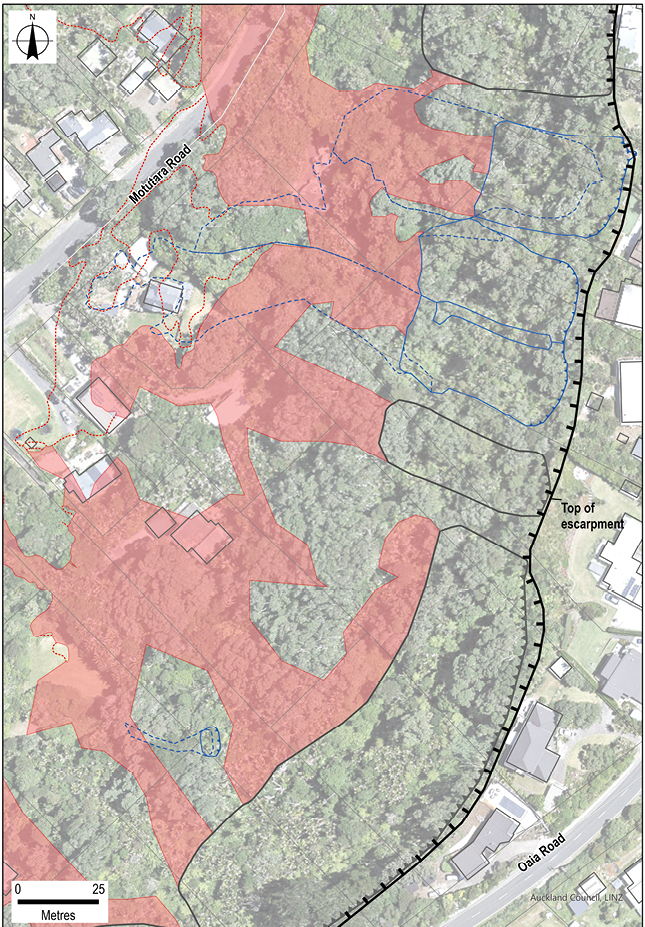
Potential landslide failure zones have been identified based on having similar geomorphology and geology to February 2023 landslide source areas. For example, the bowl-shaped head-scarp shape of recent landslides observed at the crest of the escarpment is similar to the shape of the escarpment where failures did not occur in 2023 (see Figure 9) but have almost certainly occurred at some time in the past. Hence, it can be inferred that much of the escarpment has similar landslide susceptibility due to the similar topographic, geological and possibly groundwater conditions. It was assumed that future landslides on the escarpment would have similar damaging effects to the February 2023 landslides.

A review of aerial imagery taken in 1940, 1950, 1953, 1975, 2004 and 2015 was reviewed to identify if large historical landslides had occurred. None were identified, including the known location of the 1965 event at Domain Crescent. The ten-year duration to the subsequent 1975 aerial photograph Means that the rapid vegetation regrowth experienced in this environment would be likely to have obscured many such features. Similar limitations may also apply to other unrecorded landslides.
The study area has been divided into six geomorphological ‘zones’ shown in Figure 6 based on the geomorphology, February 2023 landslide quantity and size (see Figure 10 A and B). Slope angle was also compared and grouped (see Figure 10 C and Table 2). This estimate is subjective and is an approximation only, however, it is a sound basis for differentiating between zones. The largest volume and frequency debris flows were encountered in Zone 2, 3 and 4, which are located on the escarpment. The slopes here were generally high and steep relative to other zones. Zone 5 is within a sloped area below the escarpment and experienced fewer, smaller landslides. Large landslides were not observed in Zone 1 at the northern end of the escarpment, presumably due to a more favourable, flatter slope geometry, and possibly less surface water and groundwater. Motutara Road crosses the mid-section of the slope and may act to convey stormwater away. Anecdotal evidence from residents suggests that sites at the northern end of Motutara Road (Zone 1) are drier than is typical in Muriwai.
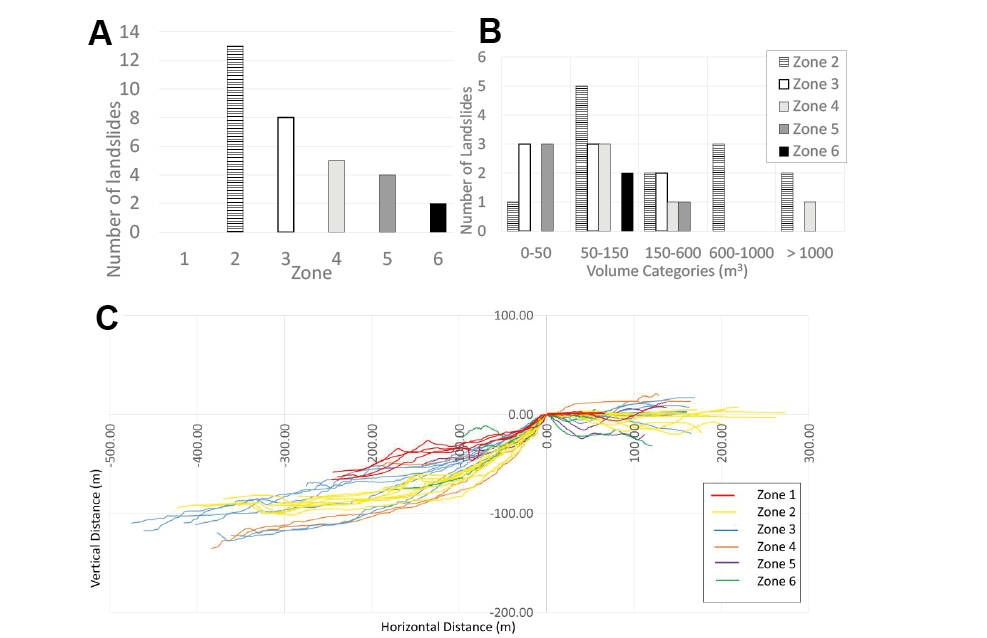
Table 2: Summary of slope angle and height for Muriwai geomorphological zones.
| Zone | Average Angle (°) | Minimum Angle (°) | Maximum Angle (°) | Approximate vertical height to nearest 10 m |
| 1 | 30 | 26 | 31 | 20 |
| 2 | 33 | 30 | 41 | 70 |
| 3 | 25 | 23 | 30 | 60 |
| 4* | 44 | Not applicable due to variable slope profile shapes | 50 | |
| 5 | 38 | 30 | ||
| 6 | 39 | 20 |
*Location of 1965 destructive landslide
5. Debris flow analysis
A computer simulated three-dimensional debris flow assessment was undertaken to provide guidance on the potential effects of future large debris flows on dwellings in Muriwai using RAMMS software (version 1.8.0, by WSL Institute for Snow and Avalanche Research).
The pre-2023 event digital elevation model (DEM – from LiDAR data) was used to calibrate existing landslides and the post-event DEM was used for future debris flows as the terrain has been altered by recent debris deposition. Comparison of the elevation of the two DEMs has identified that there is a difference between each model of up to 0.3 m, which may reflect the accuracy of one or both models.
Calibration of a RAMMS model with actual debris flow observations is important to account for the unique material and terrain characteristics in a particular location. The effects of Cyclone Gabrielle have provided a compelling dataset of landslides and associated debris runout to guide assumptions on future large slope failures on the escarpment. Aligning the RAMMS model with existing failures provides confidence in its application elsewhere on the escarpment for predictive purposes.
Four landslide areas comprising a total of 17 individually mapped landslides were used for RAMMS calibration. The selected method for modelling the initial flow was by using an average landslide ‘block release’ depth of between 0.25 m and 0.75 m, based on the mapped interpretation (‘hydrograph’ initiation was not used as it is appropriate for large catchments that report to a focal fan apex).
Parameter ranges were initially defined using guidance from the software manufacturer (RAMMS, 2022) and repeatedly tested to achieve a fit to observed landslide behaviour. The parameters are described as follows:
- Frictional parameter Mu (μ), which is unitless. It is a measure the basal friction that occurs during interaction between the surface of the flow and the ground surface below. Landslides with higher Mu values result in shorter and narrower runouts. The simulation is sensitive to this parameter.
- Frictional parameter Xi (ξ), in units of m/s2. This represents the viscous-turbulent properties of the landslide slurry. Higher Xi values indicate more laminar flows that travel further.
- Flow density (ρ), in units of kg/m3. Density represents the bulk density of solids and fluids within the flow. RAMMS (2022) recommends a value of 2000 kg/m3 if details of the landslide are not available.
- ‘Stop criteria’ that dictate when a simulation stops running in RAMMS. The simulation will stop at whichever criteria is fulfilled first. The purpose of this is to avoid misleading results due to the expansion of the debris mass at the end of the movement when most energy has been expended. The criteria are the percentage total momentum, a centre-of-mass threshold, and a model end time.
- An erosion function, which considers the accumulation of the flow on descent due to scouring.
The typical parameter ranges and those selected for optimum calibration are presented in Table 3. The erosion function was not used as concentrated, channelized debris flows were not observed in Muriwai.
Table 3: Selected input values for calibration (bold is conservative)
| Parameter | Units | Typical range | Range tested | Value selected for calibration* |
| Density (ρ) | kg/m3 | 1800-2000 | n/a | 2000 |
| Basal friction (Mu) | n/a | 0.1-0.4 | 0.05-0.5 | 0.225 |
| Viscous turbulent (Xi) | m/s2 | 100-200 | 5-200 | 87.5 |
*i.e. ‘predicted’ in Table 4
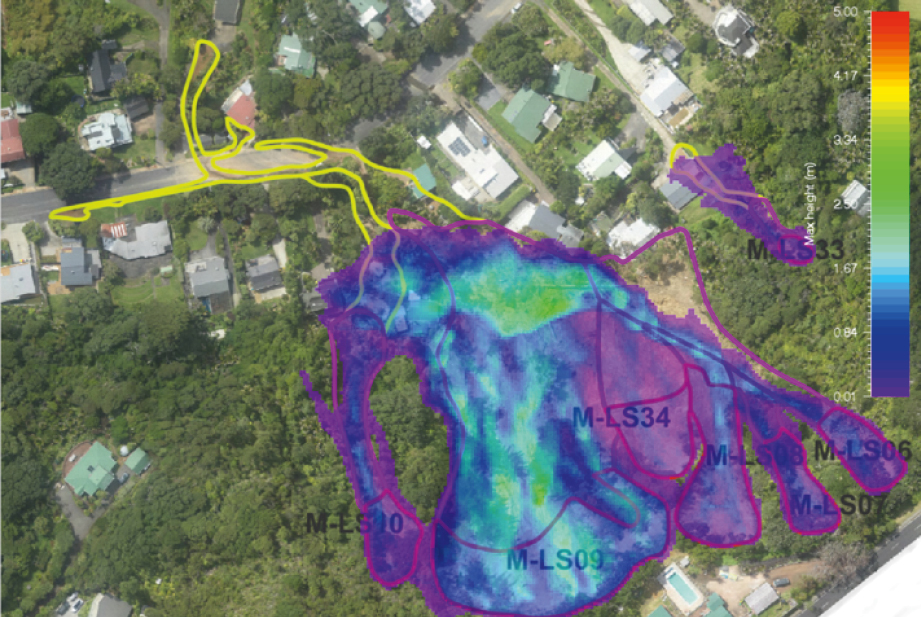
In general, the RAMMS modelling was able to be well matched to the total travel distance and width of the February 2023 landslides observed in the field (e.g. Figure 11). An assessment of the agreement of the calibration was made using the methodology of Heiser et al. (2017) that quantifies the amount of overlap between landslide debris runout and that modelled in RAMMS. The resultant fitting parameter (Ω) values of between 0.1 and 0.5 are all greater than zero, indicating a reasonable fit that is not overly dominated by underestimation or overestimation. We interpret this to mean that that the calibration has a reasonable balance of fit.
The influence of trees acting to impede or add to debris flow damage on February 2023 landslides has been observed. Similarly, buildings may alter the natural path of part or all of a debris flow. These factors cannot be specifically simulated in RAMMS and represent some uncertainty in the results.
Simulated small debris flows travelled significantly further than their observed equivalents. This is likely due to the resistance generated by large trees and dense vegetation. In addition, other factors may mean there is an insufficient supply of liquefied debris. This scenario was observed in Geomorphological Zone 5, which has relatively lower slopes (see Table 2) and smaller volume landslides (see Figure 10B). A separate RAMMS calibration was undertaken for this zone.
To predict future debris flow extent, flows were modelled along the escarpment at recorded February 2023 landslide initiating locations and at potential landslide failure zones selected based on the geomorphology. RAMMS requires an average depth for the release area (i.e. the landslide source area). The interpreted depth for each landslide was used for each of the mapped February 2023 source areas. The average depth of the mapped landslides was approximately 0.5 m and this was used for the depth of potential landslides. The simulation involved modelling the release of all mapped and potential landslides simultaneously for the predicted parameters. Conservative and non-conservative parameters were also tested (see Table 4). These are considered credible parameter endmembers that visually represent the model sensitivity presented in Figure 12. For the purposes of the risk assessment (see following section), the predicted RAMMS parameters were filtered to show where it was greater than 0.5 m thick (see Figure 13).
The RAMMS predicted runout extent of debris is in broad agreement with the ‘F-angle’ empirical landslide hazard prediction work undertaken by Auckland Council to allocate the original Rapid Building Assessment placards.
Table 4: Frictional parameters for the predicted debris flow runout. Conservative (worse case) and optimistic values are presented for comparison.
| RAMMS input type | Input parameter Mu | Input parameter Xi (m/s2) | Colour in Figure 12 |
| Predicted | 0.225 | 87.5 | Red |
| Non-conservative (optimistic) | 0.3 | 75 | Green |
| Conservative (worst case) | 0.15 | 200 | Yellow |

Our simulation does not predict which landslide sources will become debris flows in a particular event, instead presenting the debris flow potential for all sources at one time. We have tested to see if there is an effect of multiple adjacent simulated landslides coalescing and travelling further than would be the case of an individual landslide. To do this, the debris flow runout for three landslide sources was simulated individually, then all three sources were simulated simultaneously. This showed that modelling coalescing of failures from numerous landslides increases the debris flow runout distance only slightly at Muriwai – typically less than 1 m horizontally, but up to 4 m in some areas.
6. Landslide Quantitative Risk Assessment (QRA)
6.1 Assessment methodology
The loss of life QRA for large-scale debris flows affecting existing dwellings below the escarpment was carried out in general accordance with the Australian Geomechanics Society Practice Note Guidelines for Landslide Risk Management, commonly known as AGS (2007c). Dwellings that were assessed by the RAMMS simulations to be in the path of landslide runout were considered as the elements at risk. Individuals in the open, such as outside houses or roads, were not considered because the purpose of the assessment was to assess the risk for each home.
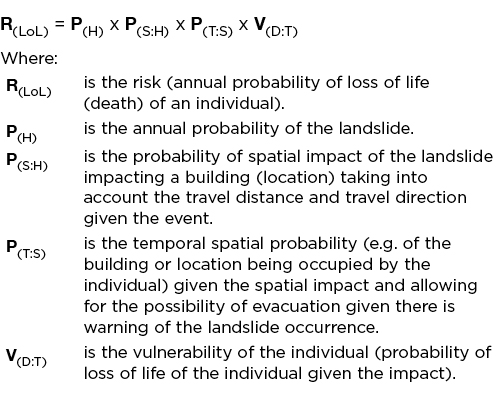
AGS (2007c) requires risks to loss of life to be estimated quantitatively for the person-most-at-risk, who will often be the person with the greatest spatial temporal probability (i.e. the person most exposed to the risk). The Individual risk-to-life is defined as the risk of fatality or injury to any identifiable (named) individual who lives within the zone impacted by the landslide; or who follows a particular pattern of life that might subject him or her to the consequences of the landslide. The risk of ‘loss-of-life’ to an individual is calculated from:
The main objectives of risk evaluation are usually to compare the assessed risk to levels that are acceptable or tolerable to the community, and therefore to decide whether to accept, tolerate or treat the risks, and to set priorities for remediation. AGS (2007d) provides recommendations in relation to tolerable risk for loss of life that have been adopted by Auckland Council (table 5). ‘Acceptable risks’ are usually considered to be one order of magnitude lower than tolerable risks.
Table 5: Suggested loss of life individual risk criteria for existing developments (AGS 2007d)
| Situation | Suggested loss of life risk criteria for the person most at risk (per annum) |
| Tolerable | 10-4, (1E-4), or 1 in 10,000 |
| Acceptable | 10-5, (1E-5), or 1 in 100,000 |
6.2 Hazard characterisation
The landslide hazard considers the following four scenarios:
- LS1a: large-scale debris flow event of a similar scale to the Muriwai February 2023 event using the ‘predicted’ RAMMS-simulated scenario.
- LS1b: the same as for LS1a but using the ‘conservative’ RAMMS-simulated scenario (i.e. longer runout distance).
- LS2a: a large-scale debris flow event that is has a smaller spatial scale than the Muriwai February 2023 event but is more frequent and using the ‘predicted’ RAMMS-simulated scenario. This is representative of the 1965 Muriwai landslide that had a smaller spatial extent.
- LS2b: the same as for LS2a but using the ‘conservative’ RAMMS-simulated scenario.
- We have partitioned the likelihood of landsliding (P(H)) into the following elements:
- P(H’1) – the probability that the threshold for landslide triggering is exceeded.
- P(H’2) – the probability that the slope for the assessment fails.
The LS1a and LS1b for P(H’1) we have adopted the frequency of the February 2023 storm, i.e. approximately 1 in 100 (i.e. 0.01). This is an appropriately conservative assumption that does not consider difficult-to-define factors that could affect stability e.g. antecedent conditions, groundwater, surface water management. For LS2a and LS2b we have assumed a landslide-triggering storm event of 1 in 50 (i.e. 0.02) because available data suggests the 1965 rainfall event was smaller than that experienced in 2023 and the event apparently causing less widespread damage.
We relate P(H’2) to the proportion slopes that have failed in February 2023. P(H’2) values for LS1a and LS1b are presented in Table 6. Geomorphological zones 1 and 6 are assigned smaller values due to the low number of landslides in 2023. We interpret landslide headscarp features to indicate susceptibility to large landslides and have adopted the P(H’2) value of 0.01. There is no basis for estimating the potential for landslides during less frequent, more intense storms, i.e. a 1 in 1000-year storm (P(H’1) of 0.001). For Zones 2, 3 and 4 the adopted P(H’2) value for LS2a / LS21b is 0.02 based on spatial analysis of historical mapping of the 1965 landslide area.
Table 6: Summary of adopted P(H’2) factors for LS1a and LS1b
| Geomorphological zone | P(H’2) |
| 1 | 0.01 |
| 2 | 0.29 |
| 3 | 0.07 |
| 4 | 0.56 |
| 5 | 0.06 |
| 6 | 0.01 |
For areas of the site located within the predicted modelled debris runout zones (LS1a, LS2a), P(S:H) = 1. For areas of the site located within the conservative modelled debris runout zones (LS1b, LS2b), we have assumed that P(S:H) is about one order of magnitude lower (i.e. about a 10% probability of exceeding the predicted modelled debris runout zones). P(S:H) is therefore = 0.1.
The adopted temporal probability P(T:S) of any dwelling in Muriwai assumes occupancy 68% of the time, which is derived from 15 hrs/day for weekdays and 20 hrs/day at weekends (Khajehzadeh & Vale, 2016).
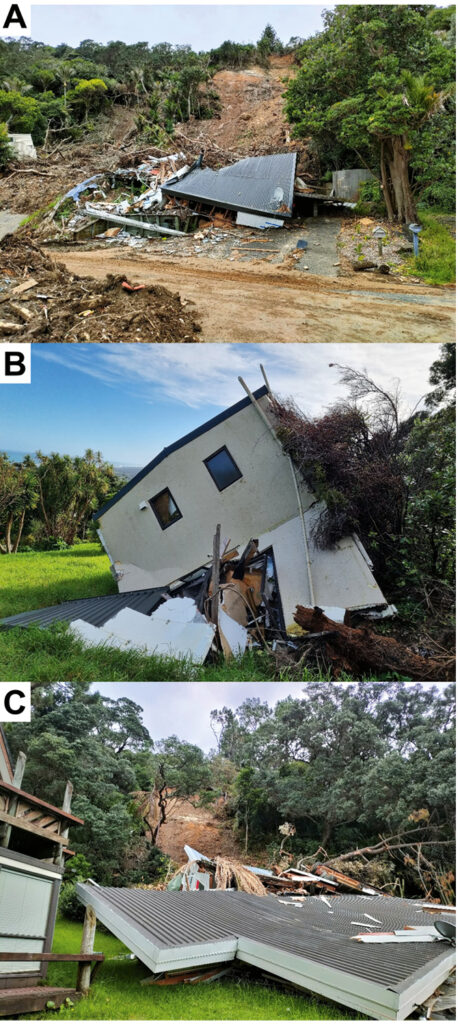
To estimate occupant vulnerability (V(D:T)) we have used observations of dwelling damage from Cyclone Gabrielle and vulnerability guidance in Finlay et al. (1999), as presented in AGS (2007c). Many houses in Muriwai are of lightweight timber frame construction and were often observed to collapse with as little as approximately 0.5 m of debris flow thickness (see Figures 14 A-C). Fortunately, most houses had been evacuated at the time of impact. The survivability would have been low had these been occupied. The destructive power of debris flows is increased where large trees are entrained and resulted in extensive damage or complete destruction in some instances in Muriwai. Experience in Muriwai indicates where collapse of an occupied house occurs, survivability is very low. Two fatalities occurred adjacent to a collapsed dwelling in 2023 and in 1965 two of four people who were occupying one of the affected houses were killed. During demolition of the collapsed homes in 2023 few survivable voids were identified.
Clearly there is variation of the potential of buildings to protect occupants from harm in the event of a debris flow impact, especially if large trees are entrained. However, for this area-wide study we consider it appropriate to adopt a single vulnerability value of 0.8 for all LS hazard scenarios where it is expected to be impacted by debris that is greater than 0.5 m thick.
6.3 Risk estimation
The overall risk to life for each geomorphological zone is shown in Table 7, which highlights that zones 2-5 have areas that are not tolerable. Two of these zones include those that experienced fatalities: Zone 2 in 2023 and Zone 4 in 1965. This assessment informed Auckland Council’s Buy-Out Programme (Roberts 2024a) with hundreds of residential buildings being designated as Category 3 (intolerable risk to life).
Table 7: Loss-of-life risk summary for by Geomorphological Zone. Not shown is Temporal
Probability (P(T:S), which is 0.68 for all) and Vulnerability (V(D:T), which is 0.8 for all)
| Geomorphological Zone | Hazard* | Annual probability of the landslide P(H) | Spatial probability | Risk | Risk Evaluation | |
| P(H’1) | P(H’2) | P(S:H) | R(LOL) | |||
| 1 | LS1a | 0.010 | 0.01 | 1.00 | 5.4 x 10⁻⁵ | Tolerable |
| LS1b | 0.10 | 5.4 x 10⁻⁶ | Acceptable | |||
| LS2a | 1.00 | 5.4 x 10⁻⁵ | Tolerable | |||
| LS2b | 0.10 | 5.4 x 10⁻⁶ | Acceptable | |||
| 2 | LS1a | 0.010 | 0.29 | 1.00 | 1.6 x 10⁻³ | Not tolerable |
| LS1b | 0.10 | 1.6 x 10⁻⁴ | Not tolerable | |||
| LS2a | 0.020 | 0.02 | 1.00 | 2.2 x 10⁻⁴ | Not tolerable | |
| LS2b | 0.10 | 2.2 x 10⁻⁵ | Tolerable | |||
| 3 | LS1a | 0.010 | 0.07 | 1.00 | 3.8 x 10⁻⁴ | Not tolerable |
| LS1b | 0.10 | 3.8 x 10⁻⁵ | Tolerable | |||
| LS2a | 0.020 | 0.02 | 1.00 | 2.2 x 10⁻⁴ | Not tolerable | |
| LS2b | 0.10 | 2.2 x 10⁻⁵ | Tolerable | |||
| 4 | LS1a | 0.010 | 0.56 | 1.00 | 3.0 x 10⁻³ | Not tolerable |
| LS1b | 0.10 | 3.0 x 10⁻⁴ | Not tolerable | |||
| LS2a | 0.020 | 0.02 | 1.00 | 2.2 x 10⁻⁴ | Not tolerable | |
| LS2b | 0.10 | 2.2 x 10⁻⁵ | Tolerable | |||
| 5 | LS1a | 0.010 | 0.06 | 1.00 | 3.3 x 10⁻⁴ | Not tolerable |
| LS1b | 0.10 | 3.3 x 10⁻⁵ | Tolerable | |||
| LS2a | 0.020 | 0.02 | 1.00 | 2.2 x 10⁻⁴ | Not tolerable | |
| LS2b | 0.10 | 2.2 x 10⁻⁵ | Tolerable | |||
| 6 | LS1a | 0.010 | 0.01 | 1.00 | 5.4 x 10⁻⁵ | Tolerable |
| LS1b | 0.10 | 5.4 x 10⁻⁶ | Acceptable | |||
| LS2a | 0.010 | 0.01 | 1.00 | 5.4 x 10⁻⁵ | Tolerable | |
| LS2b | 0.10 | 5.4 x 10⁻⁶ | Acceptable |
*Debris flows that are: LS1a = ‘predicted’; LS1b = ‘conservative’; LS2a = ‘predicted’ (less damaging, more frequent); LS2b ‘conservative’ (less damaging, more frequent)
7. Conclusions
The large landslides that occurred at the 150 m-long Awhitu Sand Formation escarpment on the night of 14 February 2023 during Cyclone Gabrielle caused damage to many houses and structures in Muriwai. The two fatalities that resulted in that event from debris flows impacting buildings were similar to two fatalities in a large storm event in 1965 that destroyed two holiday homes. The extremely weak Awhitu Sand Formation stands near vertical in places, has an elevation difference of up to 80 m and is mostly stable in normal conditions. However, during large, infrequent storm events the ground is saturated to a degree where large-volume landslides initiate and quickly transition into damaging rapid debris flow events. Antecedent conditions may have contributed, with preceding wet weather possibly elevating groundwater levels and weakening the ground.
Geology, geomorphological/topographical analysis and RAMMS debris flow simulation was used to inform a quantitative loss-of-life risk analysis of residents within their homes. A key element was the selection of the vulnerability of occupants in the event of a debris flow impact. A debris flow depth of >0.5 m was estimated as a value where fatalities were likely to occur. This was applied to all dwellings below the escarpment and considered the lightweight construction of many houses and the destructive potential of large trees when entrained within a debris flow. The results of GHD’s work was used by Auckland Council to designate 67 Muriwai properties as ‘Category 3’ (intolerable risk to life with no realistic mitigation available).
The extent of the RAMMS simulation was in broad agreement with the Fahrböschung empirical angle analysis conducted by Auckland Council to inform emergency evacuation of houses immediately following Cyclone Gabrielle.
References
Auckland Council internal memo. 2023. Guidelines on the use of AGS 2007 for landslide risk assessment in Auckland following the 2023 flooding and cyclone. 20/09/2023 by K Fordham.
AGS. 2007c. Practice Note Guidelines for Landslide Risk Management. Australian Geomechanics Society, Australian Geomechanics Vol 42 No1 March 2007
AGS. 2007d. Commentary on the Practice Note Guidelines for Landslide Risk Management. Australian Geomechanics Society, Australian Geomechanics Vol 42 No1 March 2007
Finlay PJ., Mostyn GR. & Fell R. 1999. ‘Landslides: Prediction of Travel Distance and Guidelines for Vulnerability of Persons’. Proc 8th. Australia New Zealand Conference on Geomechanics, Hobart. Australian Geomechanics Society, ISBN 1 86445 0029, Vol 1, pp.105-113.
GHD. 2024. Waitakere Coastal Communities Landslide Risk Assessment – Overall Report – Muriwai. Revision 2, 15 May 2024, ref 12612462_Overall Report_FINALRev2. Unpublished report for Auckland Council.
GNS. 2023 Cyclone Gabrielle landslide response and recovery. https://www.gns.cri.nz/news/cyclone-gabrielle-induced-landslide-mapping-project/
Hayward BW. 1976. Lower Miocene geology and sedimentary history of the Muriwai-Te Waharoa coastline, North Auckland, New Zealand; New Zealand Journal of Geology and Geophysics, Volume 19, No. 5
Hayward BW. 1979. Ancient Undersea Volcanoes: A guide to the geological formations at Muriwai, west Auckland; Geological Society of New Zealand Guidebook No. 3.
Hayward BW. 1983. Sheet Q11, Waitakere. Geological Map of New Zealand 1:50,000. New Zealand Geological Survey, Department of Scientific and Industrial Research (DSIR), Wellington.
Hayward BW. 2022. The tragic 1965 Muriwai Landslide. Geocene 28: 2-5
Heim A. 1932. Landslides and human lives (Bergstruz und Menchen leben). Translated by N. Skermer, BiTech Publishers, Vancouver, B.C., 195 p.
Heiser M., Scheidl C. and Kaitna R. 2017. Evaluation concepts to compare observed and simulated deposition areas of mass movements. Comput Geosci, 21:335-343
Hunter G. & Fell R. 2002. Estimation of Travel Distance for Landslides in Soil Slopes. Australian Geomechanics, Vol 37, No2.
IAEG, 2022. IAEG Commission C37 “Landslide Nomenclature” report on activities 2022. https://iaeg.info/wp-content/uploads/2022/08/C37-Annual-Report-2022-Final_corrected.pdf
Khajehzadeh, I., & Vale, B. (2016). How New Zealanders distribute their daily time between home indoors, home outdoors and out of home. Kōtuitui: New Zealand Journal of Social Sciences Online, 12(1), 17–31. https://doi.org/10.1080/1177083X.2016.1187636
Mitchell A, McDougall S. 2019. New empirical-statistical tools for the analysis of rock avalanche runout. Engineering Geology, 248, 1-14.
NIWA, 2023. Website news article: Auckland suffers wettest month in history. National Institute of Water & Atmospheric Research, Wellington, New Zealand. 2 February 2023. https://niwa.co.nz/news/auckland-suffers-wettest- month-in-history
RAMMS. 2022. RAMMS: DEBRISFLOW User Manual v.8.0. Davos, Switzerland: ETH
Roberts R, 2024a. A case study on managed retreat from landslide risk – lessons learned in Auckland. NZ Geomechanics News, Issue 107, p 92-105.
Roberts R., Lee K., McLelland R., Brook M. 2024b. The 2023 landslides and engineering geological response in Auckland, New Zealand. In Proceedings of the 4th European Regional Conference of IAEG.