Blue Slip is characterised by the unfavourable outcrop of bentonite 3km north of Kekerengu, North Canterbury. Despite repeated landslides impacting the key transport corridor below the landslide remains poorly defined. The aim of this research is characterisation of the landslide using methodology adopted from the Australian Geomechanics Society. Research findings indicate the hydrophilic properties of bentonite enable mass movement to occur when rainfall exceeds the trigger threshold of 120mm within any given month. This causes failure of bentonitic outcrops and the development of head scarps in regolith. Resultant material is transported through earth and debris flows. Debris flows remain the critical issue for stakeholders due to channelised flow, steep topography, volume of slope stored debris and speed of impact.
Introduction
This research concerns the characterisation of the Blue Slip landslide in order to determine the impact on the transport corridor. Blue Slip is located on the coast directly above State Highway 1 (SH1) and the Main North Rail Line (MNL). The landslide has been active over geological time and has impacted the transport corridor since the excavation of the toe during the construction of the MNL in 1931. Newspaper headlines of the time cite “a river of clay” (Evening Post, 1937). In the last 15 years there have been nine reported slips. Two were significant events which caused severe delays, blocking either one or both lanes and in one instance suspending rail service (NZTA pers. com., 2015). Due to this continued activity KiwiRail impose speed restrictions on trains. This landslide activity not only presents an inconvenience to travelers, but slows freight and threatens life safety.
Prior to this research little was understood about Blue Slip. Earlier work includes a strictly geological investigation undertaken by E. O. Macpherson in 1952; a Ministry of Works geotechnical report in the 1970’s (which was not available for review); and a brief site investigation by ENGEO on behalf of KiwiRail during 2011. These reports fail to establish geotechnical parameters or failure processes, nor do they provide any assessment of triggering events.
Given the poor understanding of landslide behaviour and controls, repeated activity, and the risk not only in terms of down-time but life safety, there is a very real need to characterise Blue Slip. This characterisation is the first step toward developing a comprehensive landslide risk management approach to the problem. The aims of this research include the identification of the scale of the problem, triggering events, typical failure processes and the understanding of geotechnical controls.
Methodology
The methodology adopted for this research is based upon a document from the Australian Geomechanics Society entitled “Landslide Risk Management, 2007”. Sections 8.4 and 8.5 of this document outline the activities required to prepare a landslide inventory and susceptibility assessment. This methodology includes those activities as presented in table 1.
The information gathered from this work satisfies the ‘Landslide Characterisation’ requirements which are a part of the broader framework for landslide risk management. This characterisation fulfils an initial, essential part of the framework and allows for future work to be undertaken including risk analysis, risk assessment and the implementation of risk management strategies. It is important to note that this research project does not address consequence analysis or risk assessment – the purpose is landslide characterisation only.
Landslide inventory
• Location, classification and volume of landslide from aerial photos
• Identify relationship between topography, geology and geomorphology
• Distinguish different parts of the landslide
• Map landslide features and boundaries
• Collect and assess historical information on activity
• Implement investigations to better define geotechnical conditions
• Geotechnical analysis to understand slope instability processes
• Cataloging of periodic reactivations and temporal windowing of triggering events
Landslide susceptibility
• Prepare a geomorphological map
• Correlate landsliding with geology and slope to delineate susceptible areas
• Correlate landsliding with annual rainfall and/or snowmelt and/or seismic loading
• Obtain basic soil classifications and depths in the study area
• Develop quantitative (often relative rating) of landslide susceptible areas
• Detailed mapping and geotechnical investigations to develop an understanding of the mechanics of landsliding, hydrogeology and stability analysis
• Implement the data and the maps in a suitable geographical information system (GIS)
Table 1: Methodology adopted for characterising Blue Slip. Modified from Landslide Risk Management, 2007 (Australian Geomechanics Society, 2007).
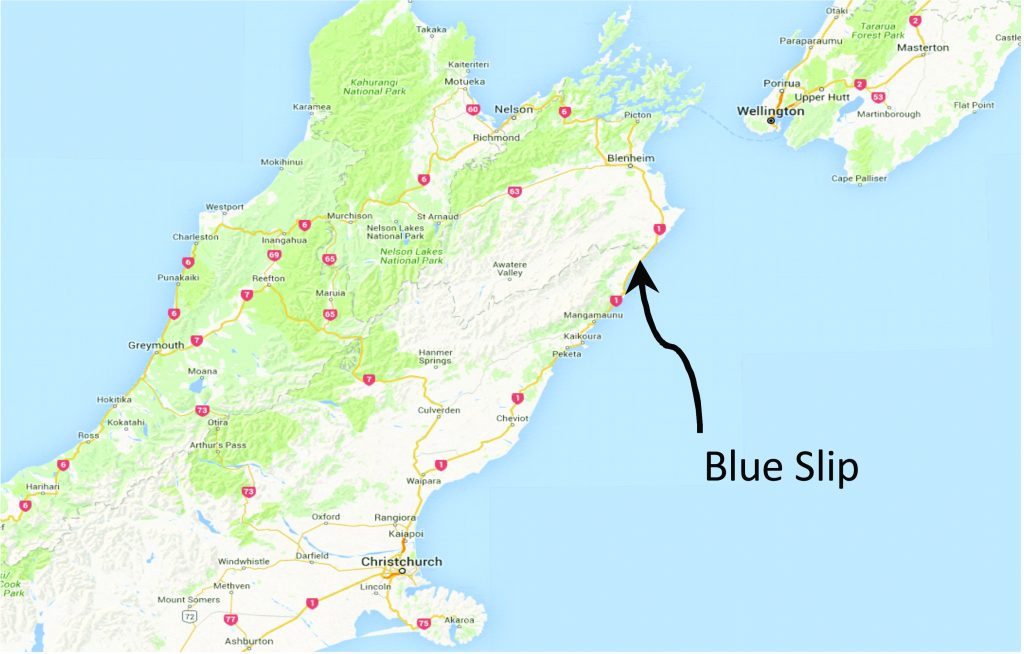
Location
Blue Slip is located approximately 3km north of Kekerengu, Clarence, North Canterbury. If travelling north, this is just before SH1 leaves the coast and travels through inland Marlborough. The landslide occupies a 0.4 km2 strip of coastal land above SH1 and the MNL. This transport corridor supports the bulk carriage of road and rail freight and passengers journeying north and south. This route also connects Marlborough and the freight and passenger ferries of Picton with the rest of the South Island.
Figure 1aFigure 1b
Figure 1: Location map (a) and an aerial photo of Blue Slip (b)
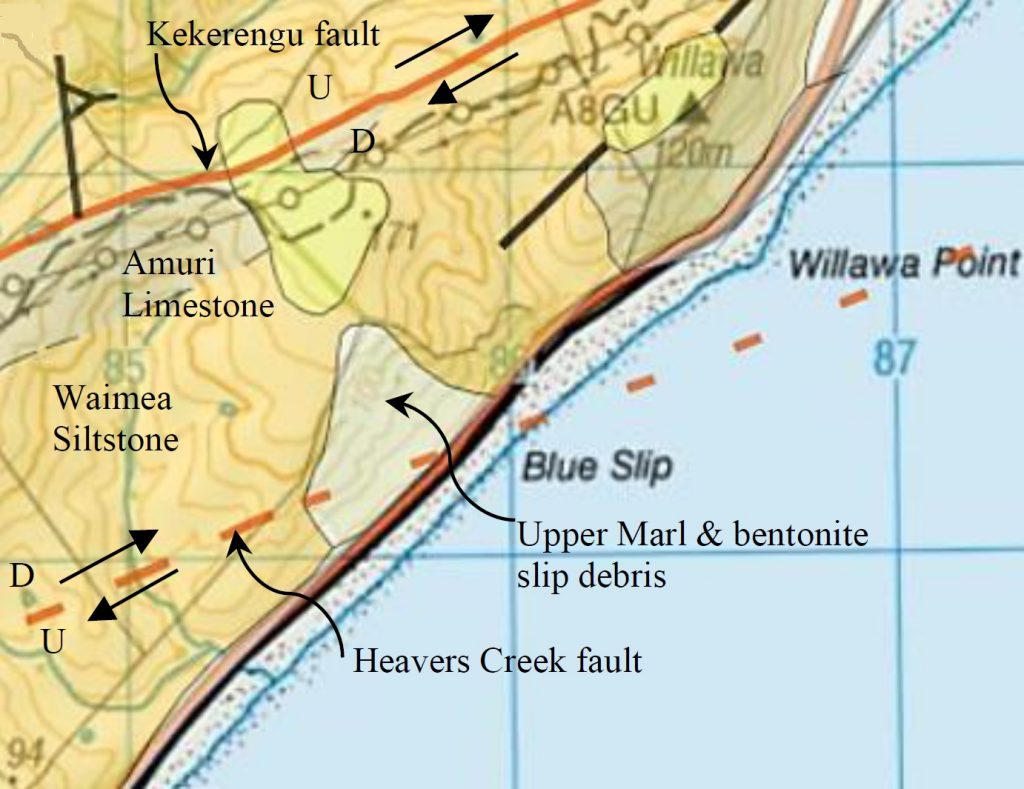
Regional geology
The regional geology at Blue Slip is complex with multiple faults, folds and geological units. The lithology exposed is dominantly marine, consisting of marl, limestone, clay and siltstone. Most are in agreement that it is the bentonitic clay unit which is prone to landsliding and slumping at Blue Slip (Macpherson, 1952; Morris, 1986). However regional faulting is responsible for the unfavourable exposure of the bentonite at this location (Morris, 1986).
The basal unit at Blue Slip is the Amuri Limestone sequence which is a white cherty limestone with a thickness exceeding 600m. This unit strikes 020° and dips south-east at 65-80° (Macpherson, 1952). At the top of the Amuri are the bentonite and bentonitic shale deposits of the Upper Marl, this unit is approximately 60m thick and dips 30-60° west-north-west into the hillside (Macpherson, 1952; ENGEO, 2011). The bentonite appears in two distinct bands of 3-12m thickness through the Upper Marl (Macpherson, 1952). The Upper Marl is bound by an unconformity with the Waimea Siltstone, the capping unit, which is of variable thickness between 5-50m. Field investigations also evidence a glauconitic greensand, assumed to be the nearby Fells Greensand. Lithology is summarised in the simplified stratigraphic column in figure 2a.
Much of the tectonic deformation in this region is associated with movement on the Hope Fault. Vin Dissen & Yeats (1991) propose that the Kekerengu fault, north of Blue Slip, accommodates as much as 60-90% of movement from the central section of the Hope Fault. Heavers Creek fault, another splay from the Hope, is thought to run through the base of Blue Slip. This is illustrated in figure 2b.
Figure 2aFigure 2b
Figure 2: Simplified stratigraphic column (a) and regional geology (b)
Geomorphology
The Blue Slip feature as illustrated in figure 1b is approximately 800m long by 450m wide, rising to a height of 140m a.s.l. The landslide slopes 16° to 30° toward the south east and the road and rail below. To the north west, above the landslide head, topography typically slopes away not toward Blue Slip. Much of the delineated landslide area appears inactive; toward the north the topography is concave and the area heavily vegetated with established growth of 50 years or more. For the purpose of this research focus is given to the total (active) area of 550m by 300m in the south, this is essentially the larger area shown in white on figure 1b.
Field Observations
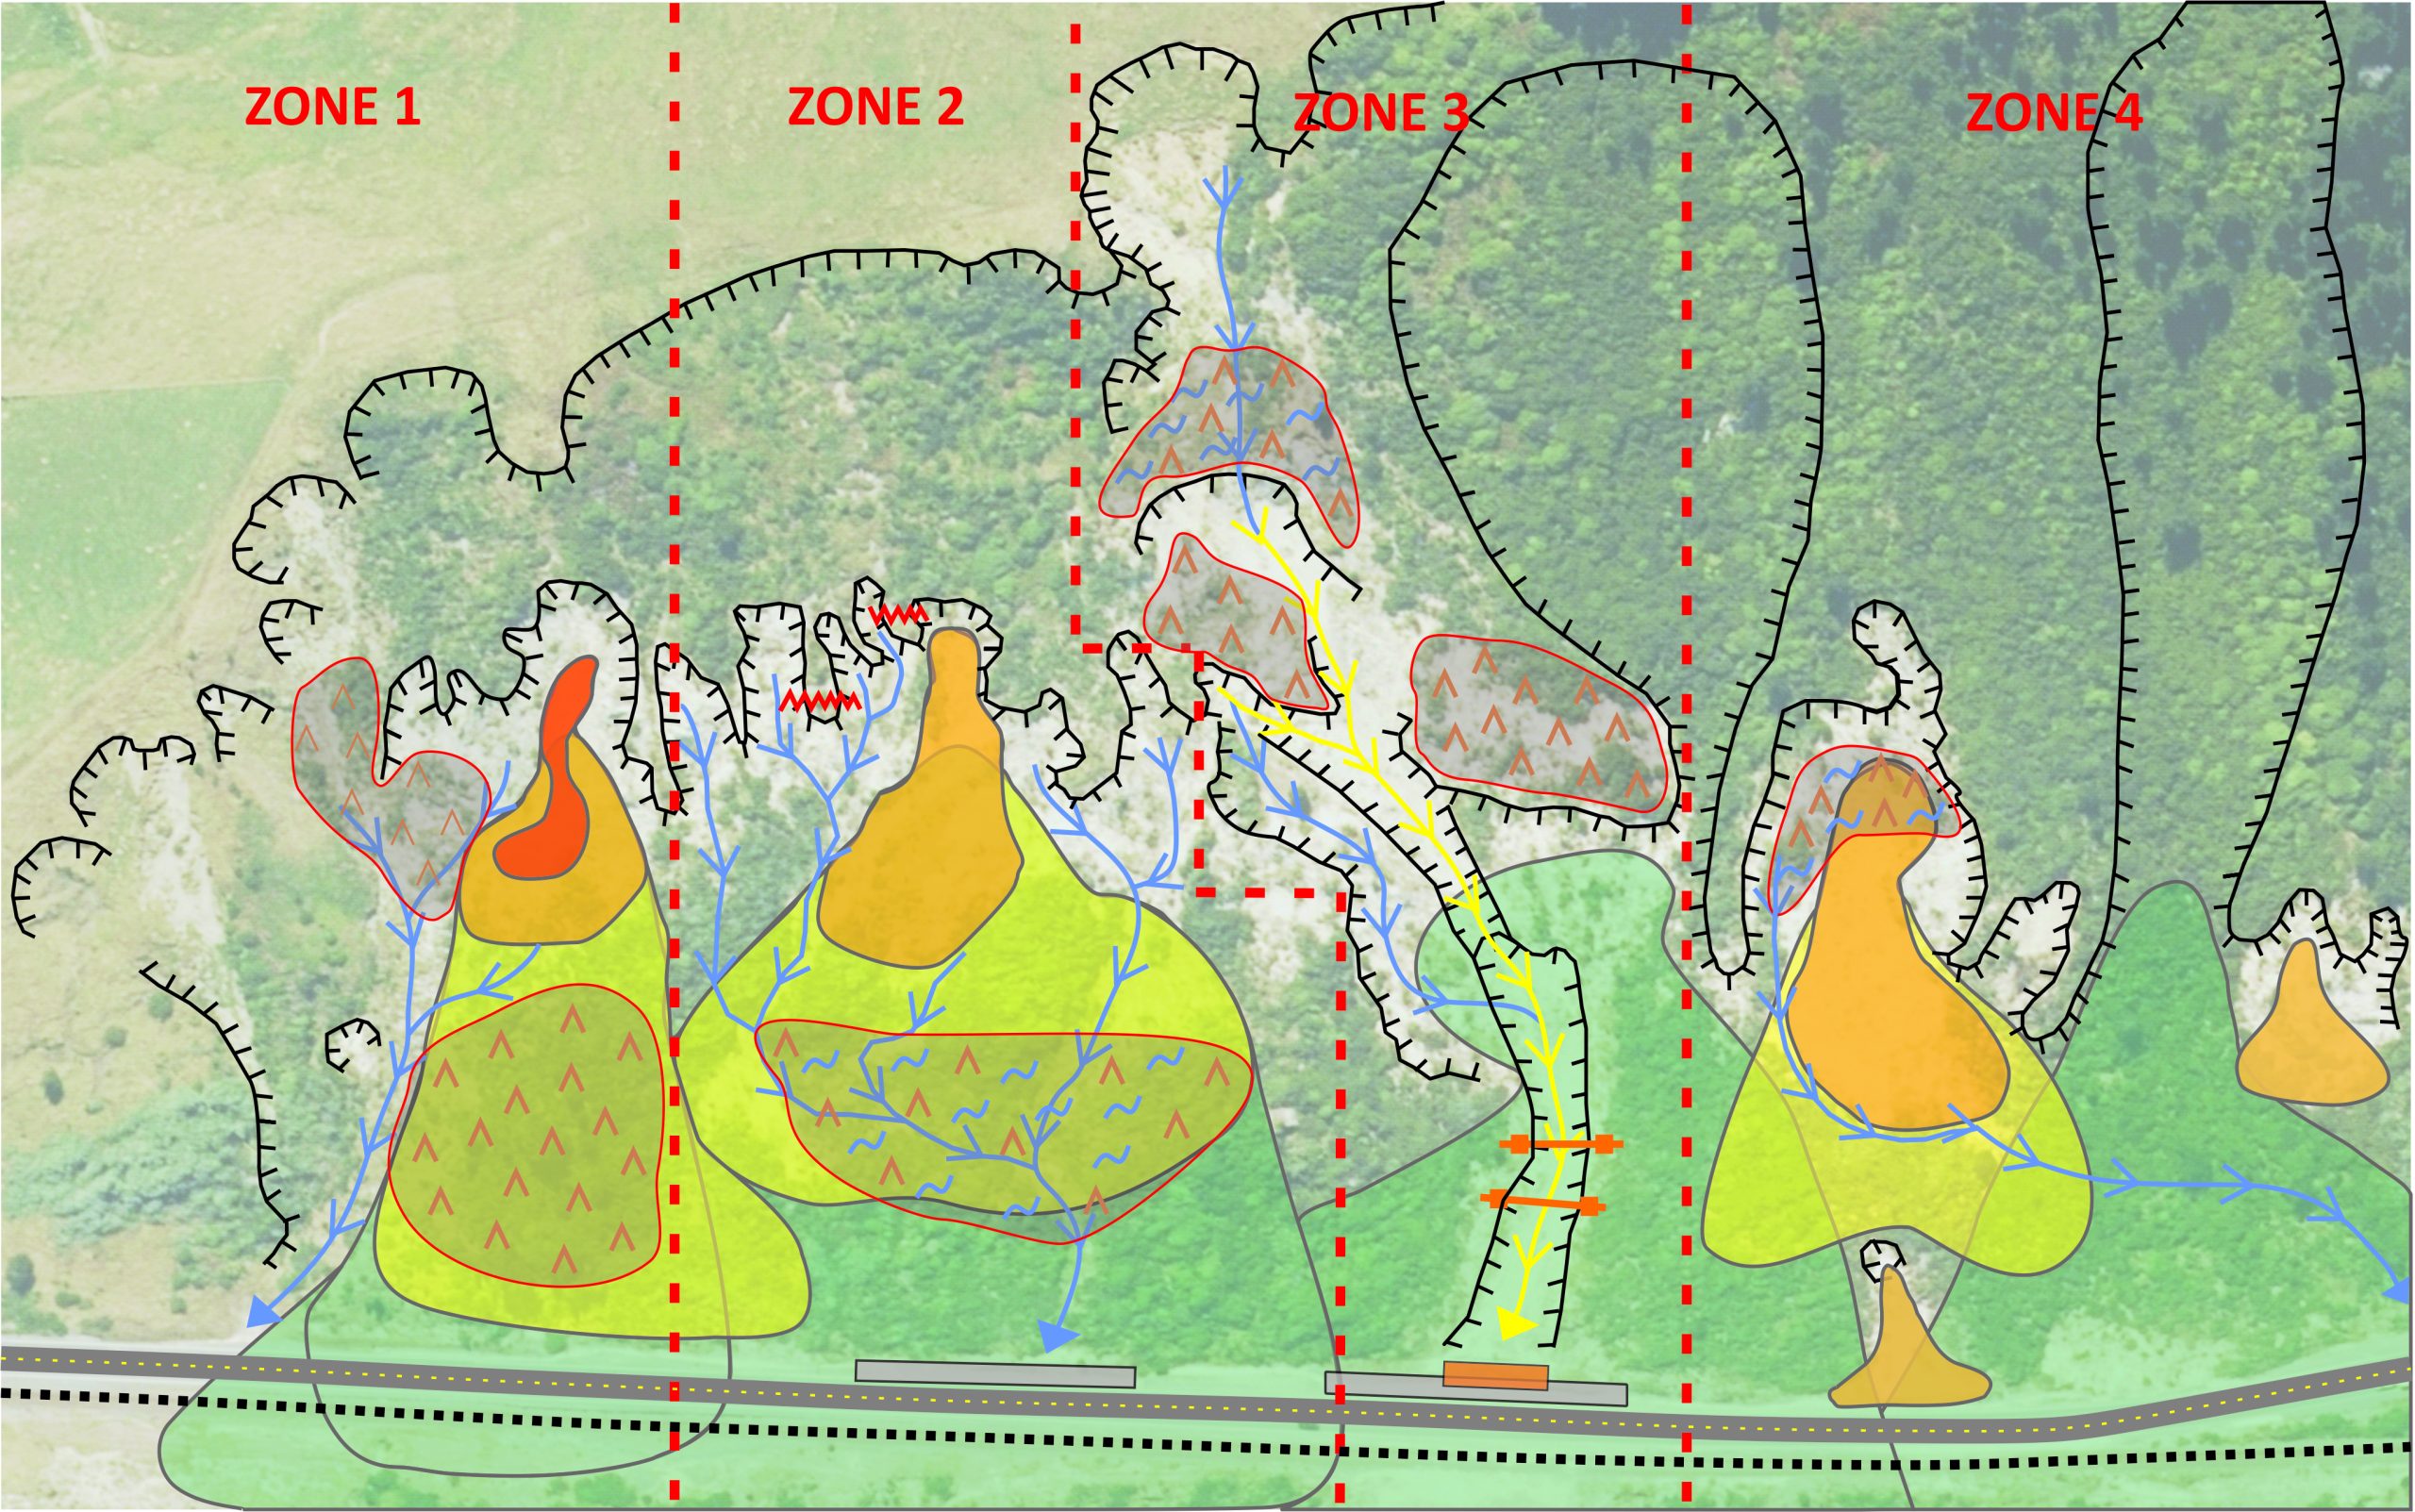
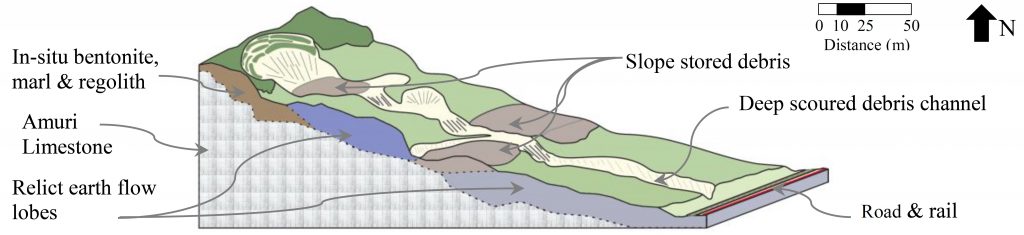
At the toe of the landslide multiple large relict lobes are visible; these dominate the lower topography, extending from mid-slope to the beach below. Wave action periodically erodes the toe of these lobes. The road visibly travels up and over these lobes while the rail cuts through the toe of each. The surface of Blue Slip is scarred with multiple ridges and gullies. These features are highlighted by white bentonite outcrops and slip debris. For the purpose of research the area is split into 4 zones, each with a unique character. These zones and the main geomorphological features (as discussed below) are also presented in the engineering geology model, figure 9.
Zone 1 and 2
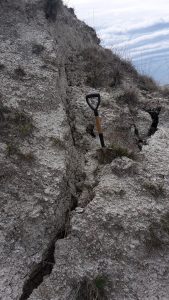
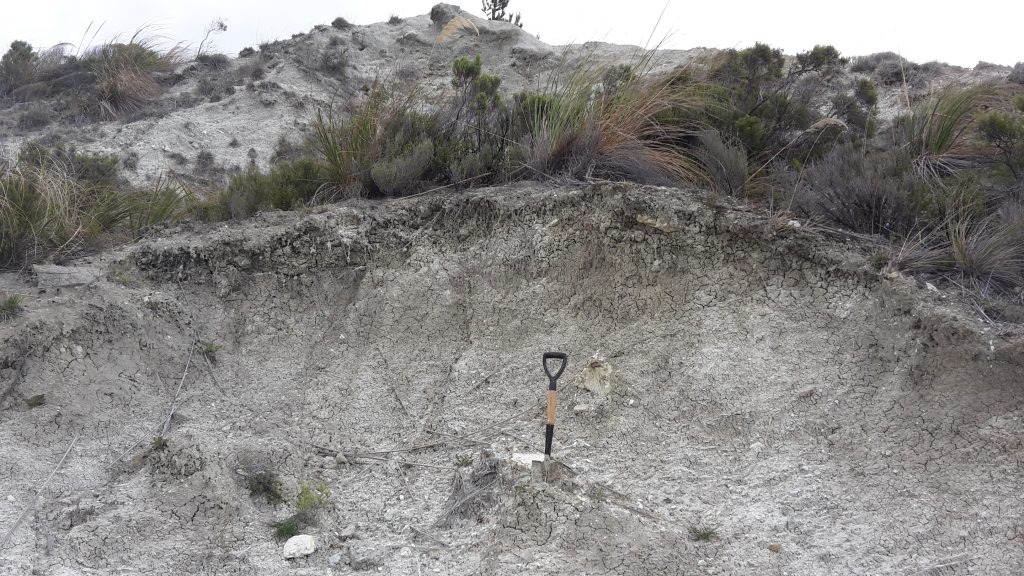
Geomorphological mapping identified 7 ridges to the south of the main debris channel. These ridges expose in-situ bentonite and small angular marl clasts. They are typically vegetated on top and stand 2 to 5m proud of the slip scarred gullies which separate them. Several ridges show evidence of progressive failure through the development of shear surfaces, some of which can be traced for over 10m with 0.5m offset. The gullies vary in size from 30m wide in zone 1 to as little as 2m wide in zone 2. All gullies exhibit a high level of activity accommodating both water run-off and the upper source of earth flow development.
These earth flows form as a result of progressive failure of the in-situ bentonite ridges evidenced by multiple scarps. Earth flows are narrow where gully confined and spread as the terrain opens and flattens. Up to 4 successive earth flows are visible emplaced over top of one another in both zones 1 and 2. While relict lobes extend to the coast more recent lobes are stalled on the mid to lower slopes. Where bentonite failure has progressed back far enough into the hillside, regolith debris is incorporated into flows due to head scarp development. Regolith head scarps are especially obvious in zone 1.
The mid-slope area where recent earth flows are stalled collects debris. This is especially true in zone 1 where multiple head scarps are visible in regolith toward the south-west. The debris is blocky and varies in size from 0.01m3 to over 0.25m3, making for rough undulating ground. This debris plus active and recent earth flow lobes are estimated to have a combined volume of 6,235m3. Photos and an interpretive block model in figure 3 illustrate typical features of these zones.
Figure 3aFigure 3bFigure 3cFigure 3d
Figure 3: Earth flow from zone 1 (a); Shear development in ridge along zone 2 (b) (for reference the spade is 1m long); ridges and gullies through zone 2 (c) and interpretive block model of zone 1 (d)
Zone 3
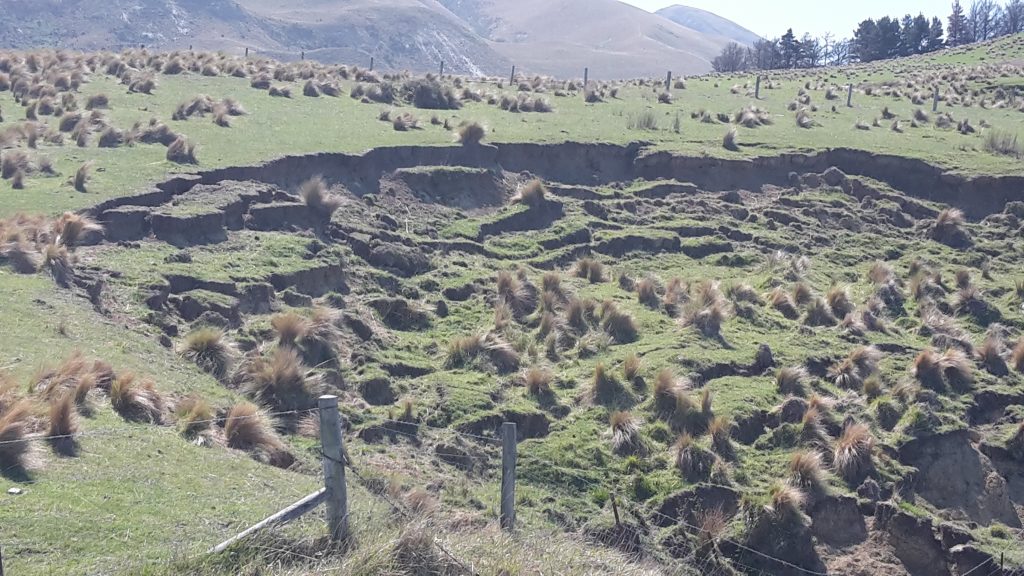
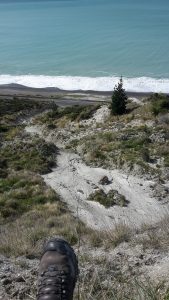
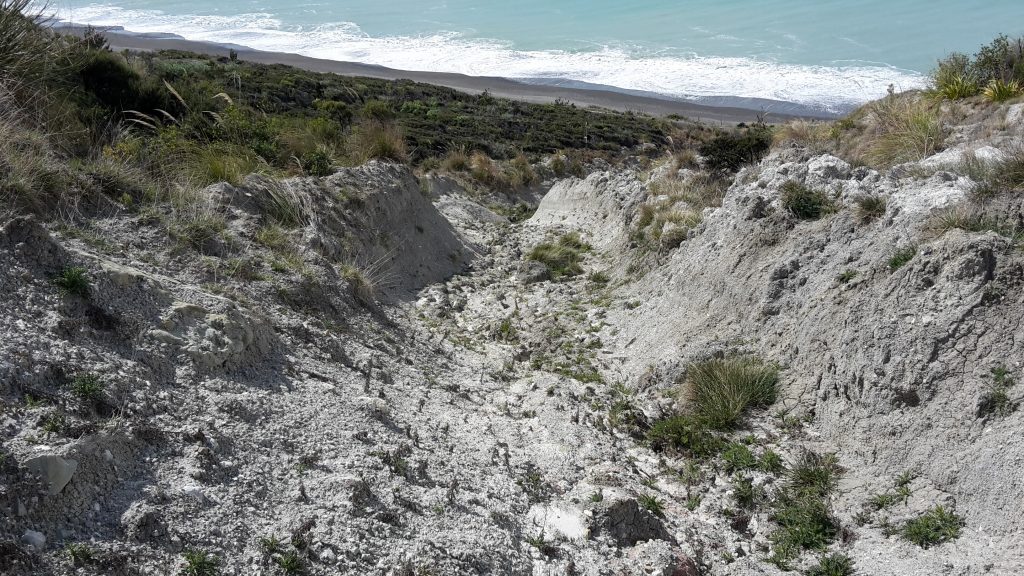
This area differs from the rest of the landslide in that greater mass movement has occurred, exposing larger outcrops of limestone beneath. This erosion has resulted in the development of an often steeply sloping debris flow channel. This is fed by a 34m wide head scarp in regolith which appears to be the source of recent debris flows. There is no evidence of any recent earth flow activity in this zone. Significant volumes of debris are stalled on flat sections of this channel. This debris has an estimated volume of 6,825 m3. Down slope of these storages the topography steepens to around 45°.
The mid and lower slopes of the debris flow channel become progressively narrower, steeper and deeper. The smearing of plants against channel walls indicates that recent flows have reached over 2.5m in depth. Photos and an interpretive block model in figure 4 illustrate typical features of this zone.
Figure 4aFigure 4bFigure 4cFigure 4d
Figure 4: Head scarp development zone 3 (a) slope stored debris zone 3 (b); mid to lower-slope debris channel (c); and interpretive block model of the debris channel (d)
Zone 4
North of the debris flow channel the area becomes progressively more vegetated and there are only 2 areas which exhibit earth flow activity. The larger of these two areas, closest to the debris channel, is occupied by 3 successive earth flow lobes. The upper reaches of these lobes are near flat where debris and surficial water occupy the area. The smaller NE area is the most northerly evidence of recent landslide activity where a single earth flow lobe is mapped. Debris and recent earth flow lobe volumes in zone 4 are estimated to be 2,535m3.
Materials
Bentonite forms by the alteration of volcanic ash fall into water. This alteration results in a clay which has several geotechnical properties that influence mass movement potential. Other materials which have less control on slope stability include limestone, greensand and regolith debris. Multiple samples were collected for laboratory analysis though initial testing suggested that two samples were deemed representative of all bentonite behaviour at Blue Slip. This included a sample from an in-situ ridge (i.e. bentonite before failure) and a sample from a recent earth flow lobe (i.e. bentonite after failure). Key findings obtained from laboratory testing include:
The natural water content averaged 44% across all in-situ bentonite samples. While samples from earth flow lobes ranged from 41% on the uppermost active lobe to as little as 27% on a relict lobe. This is illustrated in table 4.
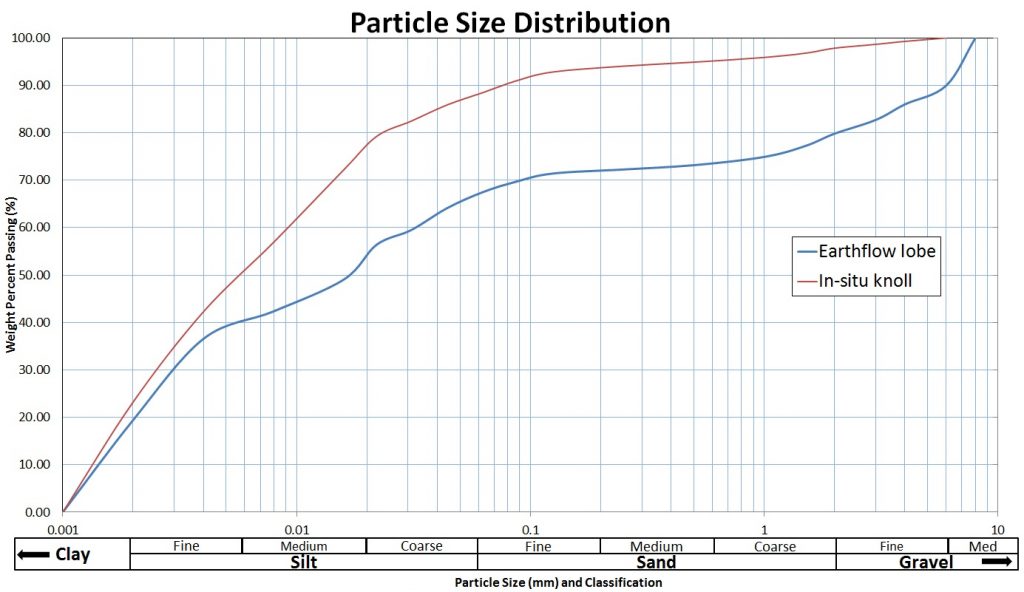
Bentonite post failure incorporates other material into the earth flow, namely head scarp debris, crushed limestone and greensand. This is supported by the presence of 20% limestone gravel in the in-situ particle size distribution compared to that of the in-situ bentonite. Similarly there is 25% clay or finer in the in-situ bentonite yet only 20% clay in the earth flow lobe. This is illustrated in figure 6.
Figure 5: Grain Size distribution for in-situ bentonite (red) and an earth flow lobe (blue), obtained in accordance with NZS4402:1986 Tests 2.8.1 and 2.8.3
Geotechnical properties
Atterberg limits
The Atterberg limits are representative of clay minerology and are used to describe behavioural change in relation to water content. Both the in-situ bentonite and earth flow lobe samples are USCS classified as a CH type soil, or clay of high plasticity. Data is presented in table 2 and key findings include:
In-situ bentonite is mouldable or deformable over a wide range of water contents due to the high liquid and low plastic limits.
The earth flow lobe bentonite is more mobile at lower water contents due to a more moderate liquid limit and low plastic limit.
In-situ bentonite
Earth flow lobe
Liquid limit
135
69
Plastic limit
25
21
Plasticity index
110
48
Table 2: Atterberg limit test results, obtained in accordance with NZS4402:1986
Shrink swell behaviour
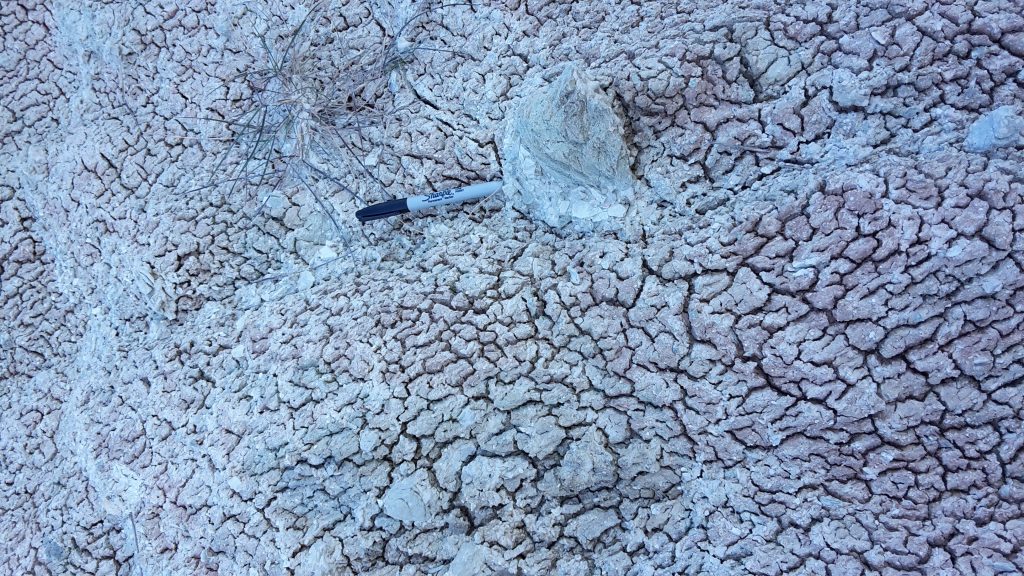
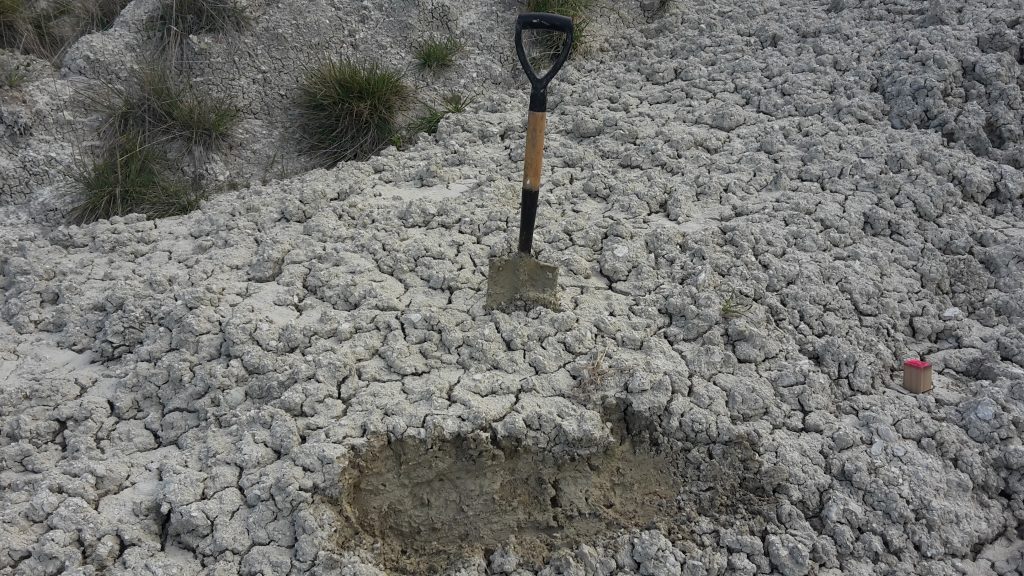
The white surface of Blue Slip is typical of dry bentonite. As bentonite dries it shrinks, forming hexagonal desiccation cracks to a depth of 30mm in-situ and 70mm on the lobes (figure 6). Furthermore when exposed to water bentonite can swell to near twice its size. These test results are presented in table 3.
Original at plastic limit
In-situ bentonite
Earth flow lobe
Shrink limit
25% (or 75% of original)
17% (or 83% of original)
Swell limit
195%
166%
Table 3: Shrink Swell test results, obtained in accordance with NZS4402:1986 Test 2.6
Figure 6aFigure 6b
Figure 6: Typical shrinkage of in-situ bentonite (a) and earth flow lobes (b). Processes facilitated by shrink swell behaviour. Note the water content of the cut-away lobe
Shear strength
The residual shear strength of bentonite was determined using a ring shear apparatus. The result is a measure of shear strength and associated parameters of the material following peak shear or failure being induced. This test does not consider pore water pressures as these were allowed to dissipate given the rate of shear induced during the test. The result is a reasonable measure of earth flow lobe behaviour but likely underestimates in-situ bentonite as peak shear most likely has not been attained. These results demonstrate the low cohesion and angle of internal friction which must be overcome for sliding to occur. Results are presented in figure 7.
In addition to the laboratory ring shear test a shear vane was employed during field work to measure the shear strength within earth flow lobes and the in-situ bentonite. As the vane only penetrates the top 300mm, these results provide an approximate measurement at 250-300mm depth. More water was obvious and less shear strength recorded toward the toe of each earth flow lobe. These results are presented in table 4 with the earth flow lobe water contents as measured in laboratory testing of samples.
Shear strength (kPa)
Natural water content (%)
Zone 1
Zone 2
Zone 4
Zone 1
Zone 2
Zone 4
In-situ bentonite
>100
>100
–
45
43
–
Upper active lobe
6
np
np
41
np
np
2nd Recent lobe
48
32
60
32
35
–
3rd Recent lobe
80
–
98
29
–
–
Relict lobe
>130
>130
>130
27
29
–
Table 4: Shear strengths (averaged from head, body and toe of lobes) as measured with a shear vane correlated with natural water content of samples. np = not present and (blank) = not tested
Figure 7
Figure 7: Mohr diagram represents residual ring shear results of in-situ bentonite and an earth flow lobe
Movement and trigger analysis
Field investigations identify the primary movement mechanism at Blue Slip is by earth flow associated with the progressive failure of bentonite ridges. Secondary movement is by debris flow caused by the erosion of underlying bentonite support, resulting in the slumping and translation of regolith material. Contrary to earlier geotechnical reports this research finds no evidence for deep seated circular failure. Given the apparent relationship with water, rainfall rather than seismic triggers are suspected.
Correlation with rainfall
Correlation was achieved using data supplied by NZTA which identified landslide events that impacted the road; and NIWA rainfall data combining information averaged across 3 weather stations within 10km of Blue Slip. The result provides a reasonable correlation of failure occurrence when monthly rainfall exceeds 120mm.Rainfall duration and intensity are also suspected to be factors contributing to failure, though no evidence of this was found in the data analysed. This data is presented in figure 8.
Figure 8
Figure 8: Historical rainfall record for Kekerengu correlated with known landslides impacting the road and rail corridor
Movement Survey
A movement survey was conducted at Blue Slip in the hope of establishing if any gradual movement was occurring. This was achieved by staking out a grid of 30 points across the landslide through relict, recent and active earth flow lobes. The initial survey was conducted on 11/10/2015 and the follow-up survey was conducted on 28/11/2015. During this period there was less than average rainfall and no reported instances of landslide failure. No movement was detected between these dates. Ideally a survey of this type should be run for at least 12 months and periodically checked / re-surveyed every 3 months. Survey data is retained and measurement stakes remain in the hope that they may be re-surveyed during future investigations.
Discussion
The potential for growth of the landslide outside current confines is limited by topography and the capping Waimea siltstone. Northern Blue Slip is inactive as identified by the concave topography, large relict lobe and established vegetation. Activity is concentrated in the south as evidenced by the scouring in the debris channel and progressively more active earth flows. This landslide activity is ultimately controlled by the behaviour of bentonite in the presence of water. These hydrophilic characteristics are obvious when considering the unique material properties of bentonite and the relationship between rainfall and failure.
Interpretation of findings and a proposed failure process
When dry, bentonite shrinks forming desiccation cracks to a maximum of 70mm depth.
The next rainfall event facilitates water ingress into the bentonite by way of these surficial cracks.
a. Water ingress is aided in the case of the earth flow lobes due to the higher concentration of gravel sized limestone inclusions and other debris. These provide a recharge conduit.
The low hydraulic conductivity (~10-10 m/s) and up to 200% swelling aids retention of the water.
This shrink swell cycle is likely repeated many times, gradually increasing the water content and the mass of water stored on the slope.
Greater than 120mm rainfall within a month triggers movement, this is facilitated by:
a. Increasing plastic deformation tending toward slurry type behaviour in relation to the increasing water content as identified in the Atterberg limits.
b. Increased pore water pressures causing a reduction in shear strength.
c. Increased weight due to the storage of water.
d. Steep topography.
Failure occurs by one of two processes:
a. In-situ bentonite and overlying head scarp material failures are due to the concentration of failure mechanisms along developing shear zones within exposed bentonite. Depending on the type of materials involved, water content and topography either earth flows or debris flows may result.
b. Earth flow lobes may be prone to earlier mobilisation and earlier transition to slurry type behaviour due to the lower liquid and plastic limits.
The rates of movement of these flows are highly dependent upon topography, water content, concentration of bentonite vs. other debris and channelisation. Typically earth flows will progress slowly and appear to creep while debris flows may move rapidly especially when channel confined.
Slope stored debris is subject to incorporation into a flow given sufficient mass, speed and viscosity. This is especially applicable in the debris flow channel but less so in areas dominated by earth flows.
Blue Slip model
The key elements of this research and interpretations have been combined into an engineering geology model as presented in figure 9. Blue Slip has been broken into zones which exhibit similar behaviour, activity level and drainage networks. Within these zones an ‘activity level’ has been determined by using a combination of natural water content from samples and shear vane recordings as a proxy for earth flow lobe activity, similarly field observations were used to quantify activity in the debris channel.
Figure 9
Figure 9: Engineering Geology Model for Blue Slip
Conclusions
The aim of this project has been the characterisation of Blue Slip and its impact on the transport corridor. This has been achieved by the completion of geomorphological mapping, field testing, sample collection, laboratory testing and data modelling. These results reveal that it is the hydrophilic properties of bentonite which are ultimately responsible for landslide activity at Blue Slip.
Primary failure occurs within the bentonitic outcrops of the Upper Marl. Rainwater infiltrates the bentonite through shrinkage cracks where it becomes trapped due to low hydraulic conductivity and swelling behaviour. Water content, weight and pore pressures increase during successive rainfall events. As a result the bentonite is subject to increasing plastic deformation which concentrates along developing shears in the bentonite ridges. Failure is triggered when rainfall exceeds 120mm within a month; this would often be associated with a high intensity rain storm. Ultimately shear strength is exceeded, cohesion overcome and failure occurs, often incorporating regolith head scarp debris into the flow.
Transport of this failed material is typically slow by way of earth flows and is dependent upon the water content, topography and involvement of other debris. Slope stored debris has potential to be incorporated into new flows given sufficient mass, speed and viscosity. Multiple earth flows have stalled on the mid to lower slopes and are subject to remobilisation given a similar process. While these earth flows have not recently impacted the transport corridor they have potential as evidenced by the size of relict lobes and recent shear development. Debris flows dominate recent activity which has impacted the transport corridor. These are related to the mass wasting of bentonite and transport of regolith debris from head scarps and on-slope storage. The channelisation, steep topography and volume of debris within the debris channel suggest probable rapid transport and likely inundation of the transport corridor.
This characterisation is near complete but would benefit from a groundwater investigation and follow-up survey to determine a rate of movement. This research has laid the groundwork on which to begin to develop a landslide risk management plan for Blue Slip. The engineering geology model illustrated in figure 9 provides a benchmark for periodic review and enables NZTA and KiwiRail to make informed decisions should mitigation be required.
References
Australian Geomechanics Society (2007, March). Landslide Risk Management, Revised Document – 2007(Vol. 41, No. 1, pp. 1-182). Author.
Charters, N. & Martin, G. (2011) Blue Slip Geotechnical Assessment. A Geoscience Consulting (NZ) report submitted to KiwiRail Network. ENGEO
MacPherson, E. O. (1952). The stratigraphy and bentonitic shale deposits of Kekerangu and Blue Slip, Marlborough, New Zealand. Journal of Science and Technology. 33, 258-286.
Morris, J. L. (1986). Engineering Geological investigations of the Wharenui Earthflow, Northeast Marlborough. A thesis submitted in partial fulfilment of the requirements for the degree of Master of Science in Engineering Geology in the University of Canterbury.
NZTA. Report on weather related events 2000 to 2015. (personal communication). (2015, December 5).
The “Blue Slip: A River of Clay. Work on the S.I.M.T. Problem for Engineers. (1937, March 23). The Evening Post. Vol. CXXIII, Issue 69, p. 10.
Van Dissen, R. & Yeats, R. S. (1991). Hope fault, Jordan thrust, and uplift of the Seaward Kaikoura Range, New Zealand. Geology. v. 19, p. 393-396.