Cantilever Pole Walls on Sloping Ground and in Cohesive Soils with Bearing Capacity Varying With Depth

Abstract
In the paper on cantilever pole walls presented in the June 2021 issue of NZ Geomechanics News (NZGN) a summary was presented of analysis methods for determining the lateral load capacity of the embedded pole foundations (Wood, 2021). The testing of rigid timber poles of similar dimensions used in cantilever pole walls in Auckland clays were discussed by Marchant and Wood in the December 2021 issue of NZGN.
The present paper provides additional information on the analysis of cantilever pole walls in both cohesionless and cohesive soils with particular reference to walls located near the crest of a down slope in front of the wall. In the June 2021 paper only the load capacity of the poles located on level ground was considered. For cohesive soils the analysis methods considered were based on the bearing capacity factor being constant with depth. An adjustment for depth variation was made by assuming a depth of ineffective soil below the ground surface with a constant bearing capacity factor below this depth. In the present paper two methods that are based on a depth variation of the bearing capacity factor are described. One of these methods (Georgiadis et al, 2013) addresses the effect of slopes on the lateral load capacity of piles in clay soils.
1. Introduction
Cantilever timber pole walls are one of the most commonly used forms of retaining wall construction used in New Zealand for low to moderate retained heights. Pole walls in New Zealand have mainly been designed using the Broms, 1964a and 1964b isolated pile theory or by continuous embedded wall theory. These commonly used design analysis methods have limitations and do not accurately represent the pole-soil interaction and displacement behaviour. In particular, the Broms method for estimating the pole lateral force capacity in cohesionless soils assumes rotation of the pole about the toe instead of the correct depth at a significant height above the toe. This simplification gives an unconservative lateral load capacity. Simplifying the analysis by assuming that the poles behave as a continuous wall is unnecessary and may introduce errors that are difficult to quantify. Although soil strength parameters are unlikely to be accurately known for design of small wall structures it is nevertheless desirable to eliminate analysis errors as far as possible and deal with the soil uncertainty by adopting moderately conservative soil strength parameters.
Pole foundation soil-interaction design should be based on pile theory that has been verified by testing. Pile design methods suitable for cantilever wall design have been presented by Guo, 2008 for cohesionless soils, Motta, 2013 for cohesive soils and by Zhang, 2018 for the mixed friction and cohesion case. The Guo, 2008 and Motta, 2013 methods are based on elastic-plastic soil response and give force versus displacement equations for loading from zero up to the ultimate hyperbolic loads. These allow serviceability displacements and the pile top lateral force capacity based on soil yield at the toe to be determined.
Application of these more correct soil-interaction pile analysis procedures to the design of cantilever pole walls is presented in Wood, 2021. Walls are often constructed in moderately steep terrain but the analysis procedures presented by Wood did not address the effect of a slope on the lateral load capacity of the pole foundation. The effect of down sloping ground in front of a wall on the lateral response of the poles and the influence of variation of the bearing capacity factor with depth in cohesive soils are discussed in the present paper. Evaluation of the governing equations of the methods investigated for slope effects and bearing capacity factor depth variation have been carried out to give load capacity and deflection results in graphical form that can be applied directly in wall design.
2. Radial Stresses in Soil From Pile Lateral Loading
To assess slope effects under lateral loading of piles, it is important to investigate the decrease in the radial stress in the soil with distance from the pile since a downslope of the ground surface partially removes the soil support at the top of the pile reducing the lateral capacity. The radial stress change in an elastic soil surrounding a horizontally loaded pile can be approximated by (Sun and Pires, 1993):
![]() (1)
(1)
Where σr is the radial stress; Gs is the soil shear modulus; u is the lateral displacement of the pile, θ is the angle between the direction of the loading and the line joining the centre of the pile cross-section to the point of interest; r is the radial distance from the pile axis; Ki (γb) (i = 0, 1) are the modified Bessel functions of the second kind of order i; ro is the outside radius of the cylindrical pile. The factor γb in Equation 1 is given by:
![]() (2)
(2)
Where L is the pile embedded length; k1 is 2.14, and 3.8 for pure lateral loading (eccentricity, e = 0), and pure moment loading (e = ∞), respectively. k1 increases hyperbolically from 2.14 to 3.8 as the free length e increases from ground level to infinitely large (Guo, 2008).
The radial stress evaluated using Equation 1 for θ = 0 and k1 = 2.14 is plotted in Figure 1 as a function of the diameter ratio r/B, where B is the diameter of the pile. k1 was taken as 2.14 (e = 0) and the L/B ratio as 5. Also shown on the plot are results from a 3-D finite element analysis (FEA) of a typical timber pole encased in concrete and embedded in an elastic soil. This analysis was part of the present study and set-up to specifically investigate the stresses in the concrete encasement surrounding the pole. The element mesh modelling the soil was not ideal for calculating the soil stresses, and the soil boundary distance from the pole was not sufficient to completely remove its effect on the radial stresses from the pole. The e/L ratio for the FEA analysis was 0.2 so the k1 value would have been greater than 2.14 assumed in the theoretical analysis which would have increased the radial stress at distances less than 1.5B from the pole by perhaps 5% and reduced the stresses at greater distances. Nevertheless, agreement between the elastic theory and FEA results is good indicating that the prediction of the radial stress in the soil by either method is satisfactory.

Theoretical analysis of the nonlinear interaction of piles laterally loaded in cohesionless soils is complex. Finite element analysis can be used to study this problem but numerical results for the range of pile geometries relevant to the present study have not been published. Lin et al, 2015 carried out an experiment on a fully instrumented short, stiff pile laterally loaded at the head to investigate the nonlinear soil-structure interaction. The pile had a steel pipe section with diameter 102 mm and a length of 1.52 m. It was installed in well-graded sand and subjected to increasing lateral load. The pile and surrounding soil were fully instrumented using advanced sensors, including flexible shape acceleration arrays, thin tactile pressure sheets, and in-soil null pressure sensors. The null pressure sensor measurements were used to develop the distribution of horizontal stress changes in the soil around the pile as the lateral pile displacement increased.
Soil pressures measured in the soil at a depth of 352 mm were presented in contour plots for a number of load levels up to the ultimate load reached at the end of the test (Wood, 2021). For the present study the radial stress in the soil along a diameter at θ = 0 were scaled from these contour plots and are shown in Figure 2 for load levels of 1.0, 0.7 and 0.23 of the ultimate (3.8 kN and head displacement of 86 mm).

Figure 2 shows that nonlinear soil response results in higher radial stresses with increasing distance from the pile than predicted by elastic theory. However, at a distance of 6B the radial stress is approximately 15% (or perhaps less) of the peak stress at the pile surface. This indicates that the soil properties at distances greater than 6B are unlikely to have a significant influence on the lateral load capacity of the pile.
3. Influence of Ground Slope on Vertical Gravity Stresses
In a cohesionless soil, the limiting force on a laterally loaded rigid pile is given by:
![]() (3)
(3)
Where Ar z is the pressure on the pile surface (FL-2 units) contributed by radial and shear stresses around the pile surface, and z the depth below the surface. Based on the tests carried out by Prasad and Chari, 1999 (and other experimental work), Guo, 2008 assumed that Ar was given by:
![]() (4)
(4)
Where γ ‘ is the soil effective unit weight. The lateral load capacity of a rigid pile will therefore be dominated by the vertical gravity stress (γ ‘ z) down the length of
the pile.
The reduction in lateral load capacity of the poles of a cantilever wall resulting from the ground sloping down from the face of the wall (slope normal to the face) was estimated by calculating the vertical gravity stress profile down the slope at distances out to 6B from the wall face. Gravity stresses were calculated using 2-D plane strain elastic FEA models. A wall height of 3 m was modelled with 2:1 and 4:1 (horizontal: vertical) down slopes commencing at the wall face. A soil unit weight of 20 kN/m3 was used.
Details of the meshes used in the two FEA models are shown in Figures 3 and 4. Results for the gravity load analyses are shown in the figures as contours of vertical stress at 10 kPa intervals. The contours show that within about 3 m downslope of the wall face there are significant variations in the vertical stress. Just in front of the wall on the model with the 4:1 slope the vertical stress at a depth of 3 m is approximately 90 kPa and on the model with the 2:1 slope the stress at the same depth is about 85 kPa. These stresses are approximately 50% greater than calculated using the depth from the ground in front of the wall, indicating that the backfill soil height behind the wall face has a significant influence on the vertical stresses below the toe of the wall face.
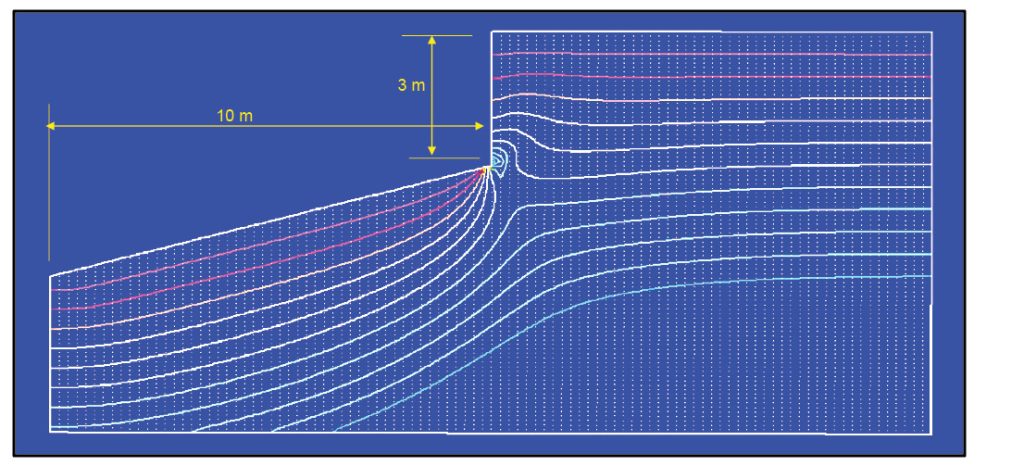
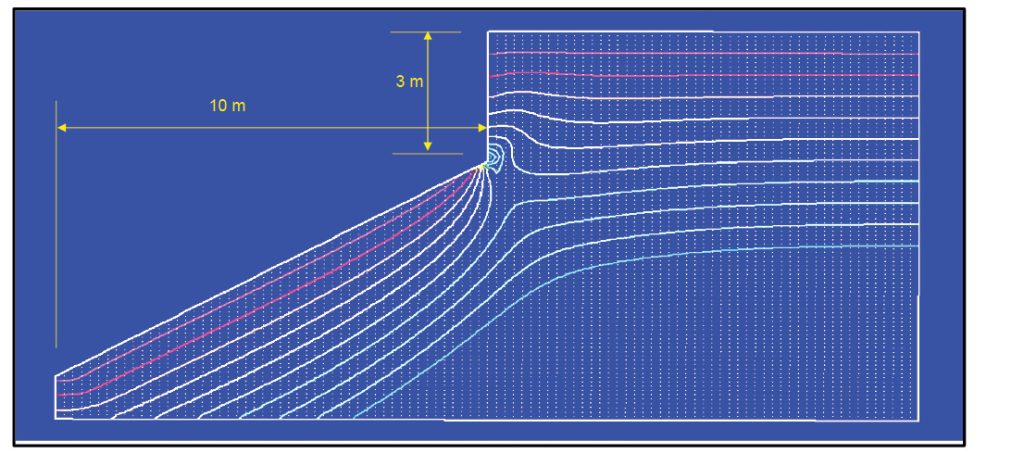
Plots of the variation of the vertical stress versus depth below the toe of the wall for distances of 0.1, 1.1, 2.1 and 3.1 m from the face of the wall are shown in Figures 5 and 6 for the 4:1 slope and the 2:1 slope models respectively. Three vertical stress profiles are shown at each distance from the wall; the stress based on the soil weight below the slope surface at the section (γ z), the stress from the FEA analysis, and the gravity stress for an assumed ineffective depth of horizontal ground in front of the wall. The ineffective depths were based on the slope surface depth at three pile diameters (3B) from the face of the wall assuming a 0.5 m pile diameter. For the 4:1 slope this gave an ineffective depth 0.375 m below the toe of the wall and for the 2:1 slope 0.75 m below the toe of the wall. Figure 7 defines the ineffective depth, Δz which is used in the following section to calculate the limiting force profile (LFP) above the rotation point on a laterally loaded pile.
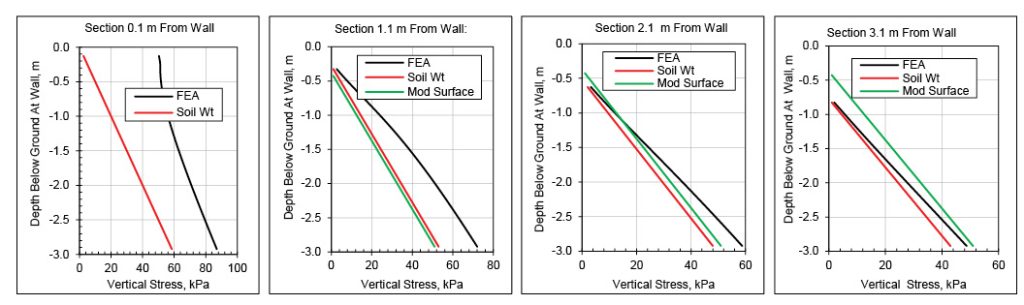
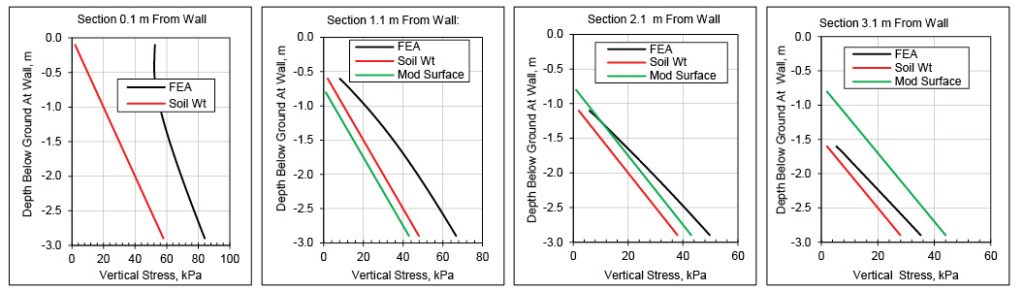
The FEA vertical stresses calculated by both models are greater than the stresses calculated from a simple analyses based on the unit weight of the soil and the depth below the slope surface. The differences exceed 50% near the wall face and reduce as the distance from the wall increases. Differences become less than 15% at a distance of 3.1 m from the wall. The weight of soil retained behind the wall face clearly has a major influence on the vertical stresses below the toe of the wall for a significant distance in front of the wall.

Stresses for the ineffective depth assumption are lower than the FEA stresses out to a distance of 2.1 m or about four pile diameters (4B). At greater distances, the ineffective height assumption gives vertical stresses greater than the FEA results. As shown in Section 2, the radial stresses from lateral loading of a pile diminish quite rapidly and are not very significant at distances of 4B or greater from the pile centre. This suggests that an ineffective height assumption based on the depth of the surface of the slope at a distance of 3B from the pile centre is likely to be satisfactory for estimating the LFP above the rotation point of a laterally loaded rigid pile. At distances closer to the pile than 4B the gravity stresses are likely to be greater than given by the ineffective height assumption and this will compensate for any reduction in gravity stresses at larger distances. Because of the complexity of the pile radial stress distribution and its interaction with the gravity stresses below the slope surface, it is not possible to determine an ineffective height by simple analysis. The assumption of basing the ineffective depth on the depth of the slope surface below the wall toe at a distance of 3B from the wall face or pile centre is likely to err on the conservative side.
4. Pile Lateral Load Capacity on Sloping Ground – Cohesionless Soil
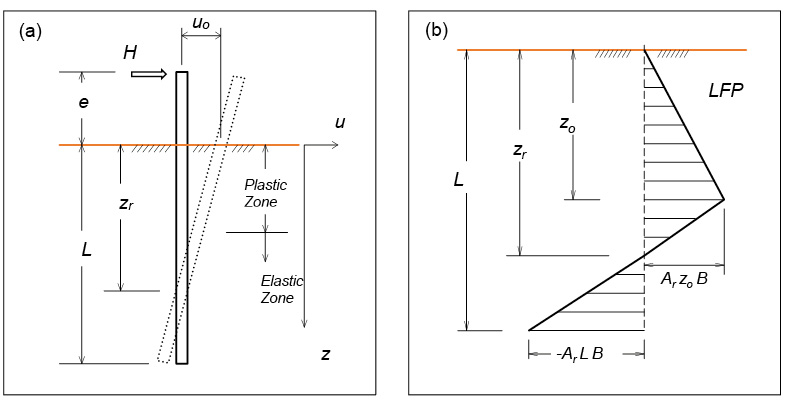
The Guo, 2008 method for calculating the lateral load capacity of rigid piles located in cohesionless soil on level ground can be modified to give an estimate of the reduced capacity when the pile is located at the crest of a downslope. Figure 8 summarises the level ground analysis method.
The soil pressure forces acting on the pile at the point when the horizontal load is sufficient to initiate soil yield at the toe of the pile can be separated into three component; a plastic force zone from z = 0 down to zo, an elastic force zone between z = zo and zr, and an elastic force zone below the rotation point depth of zr,.
The Guo, 2008 method was modified for the sloping ground case using the following two procedures.
a) Increasing the eccentricity e by the ineffective soil depth of Δz to give an effective eccentricity ee and reducing the embedded length L by Δz to give an effective length Le. The lateral load capacity at toe soil yield was then calculated using (Equation 38 from Wood, 2021):
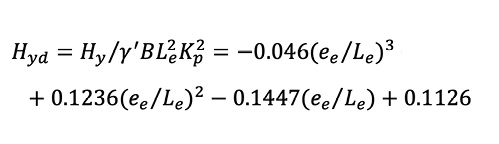 (5)
(5)
As shown in Figures 3 to 6 the gravity stresses near the wall face and under the backfill region are increased significantly by the weight of the wall backfill. Below the rotation point the pile is displacing towards the backfill into the higher gravity stress region resulting in an increase in the limiting pressures on the pile below the rotation point. Hyd computed using Equation (5) was increased by an enhancement factor, Re of 1.2 to adjust for this effect. The magnitude of the factor was determined by the more detailed analysis method described in the next paragraph.
b) The force equilibrium and moment equilibrium about the pile toe describing the soil pressures shown in Figure 8 (b) can be written as (Guo, 2008 Equations [A1] and [A2]):
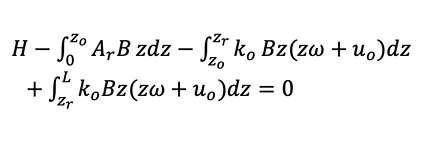 (6)
(6)
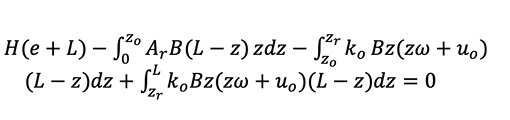 (7)
(7)
Where ko is the modulus of subgrade reaction [FL-4] for a modulus increasing linearly with depth. uo is the ground level displacement and ω the pile rotation. Simplifying the notation, Equations 6 and 7 can be written as:
![]() (8)
(8)
![]() (9)
(9)
Forces F1 and F2 were calculated assuming no pressure force on the pile over the ineffective dept of Δz. A factor of 1.5 was applied to F3 to allow for the increase in gravity stress below the rotation point. Corresponding adjustments were made to M1, M2 and M3. Equations 6 and 7 were integrated directly and then solved simultaneously by iteration (Solver in Excel) and by applying the relationship (Guo, 2008 Equations 8 and 9):
![]() (10)
(10)
Where u* is the threshold displacement at which soil yield occurs (u* is negative at the pile toe.)
Results from the two analysis procedures are shown in Figure 9. The analyses were carried out for ee/Le ratio of between 0 and 0.5 and the plotted results are for an average over this range. The toe yield capacities were found to be relatively insensitive to the ee/Le ratio. Results from the ineffective depth analysis are shown for values of Re = 1 and 1.2. A factor of 1.2 is recommended for design since using this factor gives a good fit to results from the more correct analysis using integration of the Guo, 2008 LFP forces and moments.
Also shown in Figure 9 are slope reduction factors calculated using equations given in Reese et al, 2006. The method is based on earlier work by Reese et al, 1974 who computed the ultimate lateral resistance of the piles near the ground surface by assuming a passive wedge failure in the soil. The Reese method was used to derive p-y curves for more detailed analysis of long piles and was verified using results from pile tests in clean fine to silty sands. The Reese ultimate wedge failure method gives ultimate capacities for p-y curves as a function of z/B. For the results shown in Figure 9 the ultimate capacities were averaged over a z/B range of 0.2 to 1.0. Results from Reese et al, 2006 which assume level ground beyond the crest of the slope, are in reasonable agreement with the ineffective depth method with Re = 1. This value of Re is appropriate in applications where there is no wall at the crest of the slope increasing the gravity stresses.

A number of published papers on pile lateral load tests on cohesionless slopes were sourced but only two of these were for rigid piles. Results from the Gabr and Boden, 1990 and Chae et al, 2004 tests are plotted in Figure 9 and are in reasonable agreement with the analytical methods. The Chae et al tests were carried out using smooth aluminium model piles with a diameter of 100 mm, an embedded length of 500 mm and a load eccentricity of 100 mm. The test slope was 30o and was formed from a dense sand with a peak friction angle of 47.5o. The Gabr and Borden test was carried out on a concrete pile installed to support a light standard at the crest of a 15.9o slope adjacent to a highway. The pile had a diameter of 0.76 m and an embedment depth 2.13 m. The soil was a fine-to-coarse silty sand with a friction angle of approximately 40o.
There was level ground beyond the crest in both the Chae et al and Gabr and Boden tests carried out for piles located on the slope crest. The test results would therefore be expected to lie closer to the ineffective depth Re = 1.0 curve than the Re = 1.2 curve which was derived for the case of a wall at the crest and the associated increase in gravity stresses.
For comparison with the reduction factors shown in Figure 9 for the test on short rigid piles; Baker, 2012 reported a load reduction factor of 0.7 for a long pile (L/B of 30) located at the crest of a 26.6o slope and Mirzoyan, 2007 a reduction factor of 0.77 for a long (L/B of approximately 42) located at the crest of a 30o slope. These reduction factors are significantly less than indicated by the tests and analyses for short rigid piles.
The reduction factors for the ineffective depth and Guo, 2008 integration methods shown in Figure 9 were calculated assuming a 0.5 m diameter pile with an embedded length of 3 m. They are plotted versus the slope angle since this enabled the reduction factors to be compared directly with the Reese et al, 2006 analysis and the pile test results. The pile length and diameter were typical values that might be used for a pole wall near the crest of a slope. However, to eliminate the influence of the assumed pile dimensions on the results a better approach for design is to use the slope angle and pile diameter B to determine the ineffective depth Δz as shown in Figure 7 then to use Figure 10 which shows the reduction factor plotted as a function of Δz/L. (Alternatively, Equation 5 can be used with Hy increased by a Re factor of 1.2.)

5. Pile Lateral Load Capacity – Cohesive Soil with Varying Bearing Capacity Factor
Wood, 2021 summarized the methods most commonly used to determine the ultimate lateral load capacity, Hu for a short rigid pile assuming level ground and a cohesive soil. These methods, including the method by Broms, 1964b, were based on assuming simplified distributions of the limiting soil reaction along the pile length. Wood recommended for design that the variation of the reaction near the surface could be approximated by assuming a depth of zero soil resistance and that below this depth the limiting soil reaction was uniform. These assumptions were similar to those adopted by Broms, 1964b but the depth of zero resistance was taken as 0.1 to 0.2 times the embedment length, L rather than 1.5 times the pile diameter, B.
Georgiadis et al, 2013 developed analytical equations to determine the undrained lateral bearing capacity of rigid piles in cohesive soil. Piles placed in level ground and piles placed at a distance from the crest of a slope were examined, taking account of the effect of the adhesion at the pile-soil interface. Their analytical equations give the lateral load pile capacity as a function of the pile length/diameter ratio, the pile-soil adhesion, the distance of the point of load application from the ground to the pile diameter ratio. For piles near sloping ground, the inclination of the slope and the ratio of the distance of the pile from the crest of the slope to the pile diameter were parameters in the capacity equations.
The ultimate lateral soil reaction per unit pile length can be expressed as:
![]() (11)
(11)
Where Np is a bearing capacity factor which varies with depth, su is the undrained shear strength and B the pile diameter.
Georgiadis et al, 2013 examined a number of Np versus depth below ground, z relationships obtained experimentally, analytically, or numerically including those of Stevens and Audibert, 1980; Murff and Hamilton, 1993; Matlock, 1970; Reese and Welch, 1975; Bhushan et al., 1979; Reese et al., 1975; Broms, 1964; Hansen, 1961; Jeanjean, 2009; and Georgiadis & Georgiadis, 2010. Plots of some of these relationships are presented in Figure 11 for piles located in level ground.

There is large scatter in the Np versus depth relationships plotted in Figure 11. Georgiadis and Georgiadis, 2010 indicated that the dependence of Pu on the pile-soil adhesion is very significant and one of the main reasons for the scatter. Based on the results of 3-D finite element analyses and comparisons to pile load test results, they proposed the following Np versus z/B relationship for piles located at the crest of a slope:
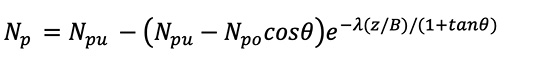 (12)
(12)
Where θ is the ground slope measured from the horizontal, λ = 0.55 − 0.15 α ; α is the pile-soil adhesion factor that ranges from 0 for a smooth pile to 1.0 for a rough pile. Npu is the ultimate bearing capacity factor for deep lateral flow of soil, Npo = 2 + 1.5α is the bearing capacity factor at the ground surface.
To study the effect of the distance between the pile centre and the crest of a clay slope, on the lateral pile behaviour, Georgiadis et al, 2013 performed a detailed 3-D finite element study which led to the modification of Equation 12. The resulting variation in Np with z/B is equal to the bearing capacity factor for horizontal ground up to critical depth zc. Below this critical depth, Np is determined by the following equation:
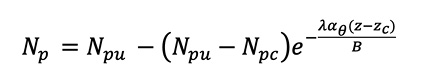 (13)
(13)
Where αθ is a factor depending on the inclination of the slope and is given by:
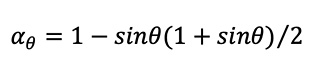 (14)
(14)
zc is the critical depth which depends on the distance between the pile and the crest of the slope, b and is given by:
![]() (15)
(15)
Npc is the bearing capacity factor at the critical depth, obtained from Equation 12 for z = zc and θ = 0.
The Georgiadis et al, 2013 bearing capacity factor for level ground is given by Equation (12) with θ = 0.

The analysis lateral earth pressure definition diagram given in Georgiadis et al, 2013 is shown in Figure 12. The horizontal force and bending moment equilibrium equations contain two unknowns; the rotation depth zo and the ultimate lateral load capacity Hu.
The two equilibrium equations are:
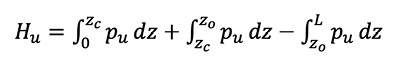 (16)
(16)
![]() (17)
(17)
The solution of these two simultaneous equations gives:
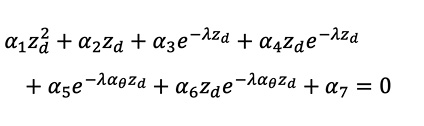 (18)
(18)
Where zd= z0/B and the coefficients α1 to α7 are functions of Npu, Npo, Npc, B, e, λ, αθ, L and zc and are given in the Appendix.
The horizontal force equilibrium Equation 16 for the zd value derived from the solution of Equation 18 (by iteration) gives the dimensionless lateral force capacity as:
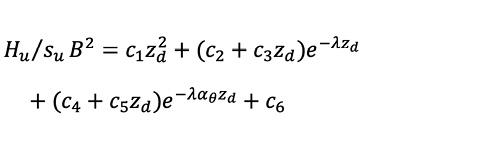 (19)
(19)
Where the coefficients c1 to c6 are functions of Npu, Npo, Npc, B, e, λ αθ, L and zc and are given in the Appendix.
There is no slope effect on the lateral load capacity of the pile when the depth of rotation derived from Equation 18 is less than the critical depth zc. In this case the solution equations for zd and Hu are simplified. However, for typical pole wall foundations it is very unlikely that zo will be less than the critical depth. For example, for a L/B ratio between 4 and 6 and for b/B between 0 to 4 the zc /L ratio is less than 0.62 and the zo /L ratio greater than 0.68 for slopes from 0 to 30o.
Zhang and Ahmari 2013 presented a method for the nonlinear analysis of laterally loaded rigid piles in a cohesive soil on level ground. As with the Georgiadis et al, 2013 method, a nonlinear variation of lateral resistance with depth was considered. The Zhang and Ahamari, 2013 method extended the Georgiadis et al, 2013 approach by considering the nonlinearity of the modulus of subgrade reaction with the pile displacement at ground level. The modulus of subgrade reaction was assumed to be constant with depth.
Zhang and Ahmari, 2013 assumed that the bearing capacity factor was given by:
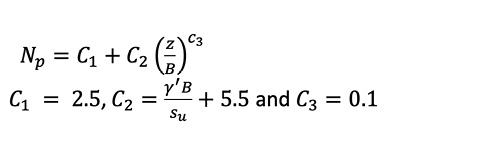 (20)
(20)
Where 
A comparison of the Equation 20 relationship with the level ground bearing factor relationship used by Georgiadis et al, 2013 is shown in Figure 13.
The Np variation with depth used by Zhang and Ahmari, 2013 is clearly very different from that proposed by Georgiadis et al, 2013. Before deciding on the best method of analysis for piles located at the crest of sloping ground, a comparison of the ultimate and toe yield lateral load capacities obtained by using the Zhang and Ahmari, 2013, Georgiadis et al, 2013 and the recommended methods given in Wood 2021 (based on Motta, 2013 and Zhang, 2018) for level ground was carried out.

Comparisons of capacities calculated by the three methods for the toe yield and ultimate load cases are shown in Figures 14 and 15 for e/L ratios of 0 to 1.0. The Motta, 2013 (toe yield) and Zhang, 2018 (ultimate) capacities are based on a Np value of 10.8 assumed constant with depth below an upper soil layer assumed to be ineffective with an Np of zero. An Np of 10.8 assumes that the pile is intermediate between smooth and rough (deep failure Np values of 9.14 and 11.94 respectively). The Georgiadis et al, 2013 capacities are also based on a pile with intermediate roughness using α = 0.5. The Motta, 2013 and Zhang, 2018 capacities are shown for ineffective depth values of Δz/L = 0.1 and 0.2. Because of the variation of Np with depth assumed in the Zhang and Ahmari, 2013 and Georgiadis et al, 2013 methods, the capacities are a function of the L/B ratio although the capacities are not very sensitive to this parameter. Capacities are shown for L/B values of 4 and 6 which covers the typical range for cantilever pole walls.


The toe yield capacity is recommended for design (Wood, 2021) and this capacity is about 15 to 20% lower than the ultimate capacity for all the methods. Figure 14 shows that the toe yield capacity from Georgiadis et al, 2013 agrees reasonably closely with the Motta, 2013 value for Δz/L =0.2 and is about 20% to 15% lower than the capacities given by Zhang and Ahmari, 2013 for L/B values of 4 and 6 respectively.
Zhang and Ahmari, 2013 show good agreement between their force versus displacement predictions and a number of test results. Georgiadis et al, 2013 show good agreement between their ultimate capacity predictions and test results.
6. Pile Top Deflections in Cohesive Soil
From the comparisons made above it appears that the Zhang and Ahmari, 2013 method may give unconservative lateral load capacities. However, Zhang and Ahmari, 2013 provide Young’s and subgrade modulus values for clay that can be used for estimating the pile top deflection. Table 1 lists the Young’s modulus values that they recommend for clays.
Table 1. Elastic Modulus for Clays.
| Clay Consistency | Shear Strength, su kPa | Young’s Modulus, Es MPa |
| Very soft | 2-25 | 0.5-5 |
| Soft | 25-50 | 5-20 |
| Medium | 50-100 | 20-50 |
| Stiff | 100-200 | 50-100 |
The low strain modulus of subgrade reaction can be estimated from:
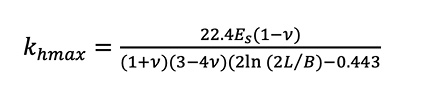 (21)
(21)
Where L and B are the pile length and diameter respectively and Es and υ the Young’s modulus and Poisson’s ratio respectively of the soil. Zhang and Ahmari, 2013 indicate that the relationship in Equation 21 is affected by the fixity of the pile head.
The variation of kh with the pile ground surface displacement uo can be represented by (Zhang and Ahmari, 2013):
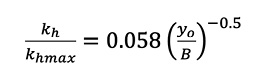 (22)
(22)
Dimensionless ground level displacements (uo kh /su B) resulting from the lateral load that initiates yield in the soil at the pile toe calculated using Georgiadis et al, 2013, Zhang & Ahmari, 2013, and Motta, 2013 are compared in Figure 16. Although all three methods are based on quite different Np variations with depth, they give ground level displacements that agree within about 25%. All three methods are based on the assumption that the modulus of subgrade reaction kh is constant with depth. The deflection analyses for Georgiadis et al, 2013 and Motta, 2013 assume that the modulus of subgrade reaction varies linearly with displacement up to the soil yield level (elastic-plastic response).
In the Motta, 2013 analysis no reduction in the modulus was made for the upper soil layer. The Georgiadis et al, 2013 and Zhang and Ahmari, 2013 displacements were calculated for L/B ratios of 4 and 6. Small differences in displacements occur over this typical range for pole walls because of nonlinear bearing capacity variations with depth.
The ground level displacement at toe yield can be estimated by an iterative procedure using Figure 16 together with Equation 22. Adopting this approach an estimate of kh (based on Equation 21) allows the actual displacement to be estimated from the dimensionless value shown in Figure 16. kh can then be revised using Equation 22.

7. Reduction in Lateral Load Capacity on Sloping Ground – Cohesive Soil
Equations 13 to 19 from Geogiadis et al, 2013 were used to calculate the lateral load capacity reduction from the level ground capacities for poles located at the crest of a slope (b = 0) and for poles located on level ground at a distance of b = 2B from the crest. The pile adhesion factor α was taken as 0.5. Analyses were carried out for eccentricity ratios e/L of 0 and 0.5, L/B ratios of 4 and 6 and for slopes varying from 0o to 30o (measured from the horizontal). The reduction factor Rf = lateral capacity on sloping ground capacity/lateral capacity on level ground is shown in Figures 17 and 18 for b = 0 and b = 2B respectively.
For typical e/L and B/L ratios used in pole walls Figure 18 shows that the lateral load capacity reductions from the level ground case are less than 5% at distances of 2B or greater from the crest for slopes up to 30o. These capacity reductions are small and this is partly due to the relatively small pole embedment depth. Even with the piles at the crest of the slope, reductions in lateral capacity are less than 25% as indicated by Figure 17.


Stewart, 1999 used an upper bound plasticity method to estimate the undrained collapse load of laterally loaded piles in clay soils. Figure 19 summarises the analysis assumptions. It was assumed that a deforming conical wedge of soil forms near the surface, and below the base of the wedge the soil is assumed to flow horizontally around the pile. It was also assumed that a gap develops behind the pile above the base of the wedge. The pile was allowed to rotate about a point that is located below the base of the wedge. Resistance to lateral displacement and rotation of the pile is assumed to be comprised of energy dissipation due to:
- Deformation of soil within the wedge
- Work done by the soil weight within the deforming wedge as it moves upward
- Shear along the wedge-soil interface
- Shear along the pile-soil interface as the wedge moves upwards
- Flow of soil around the pile below the base of the wedge with a limit pressure of 9 su
- Shear of soil over the base of the pile
The numbers in the above list refer to the components shown on Figure 19.

The effect of a slope adjacent to the pile was incorporated by truncating part of the assumed collapse mechanism (Figure 19). Stewart concluded that the slope reduction factor depends largely on the distance of the pile from the crest of the slope, the slope gradient, and the length to diameter ratio. Stewart indicated that for the case of level ground, the method yielded results that were similar to those from Broms, 1964b.
Stewart’s results for the pile located at the crest of the slope and with the load eccentricity ratio, e/L = 0 are compared in Figure 20 with those of Georgiadis et al 2013 for an L/B ratio of 4. Limited results were given by Stewart for the range of piles relevant to pole walls. Only one result for an L/B ratio of 6 was given and this is plotted on Figure 20. The Stewart results are for a smooth pile and the Georgiadis et al, 2013 results shown in Figure 20 are also for this assumption.
Also plotted in Figure 20 is a reduction factor, Rf given by:
![]() (23)
(23)
The Equation 23 slope reduction factor is given in the Technical Manual for the LPile software (Isenhower and Wang, 2013). This manual references Reese, 1958 who developed an equation for the ultimate lateral resistance of a pile in a clay soil assuming a simple triangular shaped wedge failure near the ground surface. Reese, 1958 did not consider a sloped soil surface but apparently Equation 23 comes from a geometric modification to the wedge assumed by Reese.

Published test results for lateral loading of a rigid pile on slopes are limited. Bushan et al, 1979 carried out a single lateral test for a 5.18 m long drilled pile with a 1.22 m diameter (L/B = 4.2) and load eccentricity of 0.23 m (e/L = 0.044) on the crest of a firm clay soil 20o slope. The soil shear strength and measured ultimate capacity as reported by Georgiadis et al. 2013 were 220 kPa and 2,180 kN respectively. The predicted lateral load capacity using the Georgiadis et al, 2013 equations and assuming α = 0.24 (computed from su using Georgiadis et al, 2013) was 2,705 kN; a 24% overprediction of the measured capacity. For the test pile the Georgiadis et al, 2013 method gave a slope reduction factor of 0.86 which is in agreement with the value estimated from Figure 17.
For design of pole walls near the crest of a slope the Stewart L/B = 4 curve gives satisfactory reduction factors. Georgiadis et al, 2013 may underpredict the reduction and Equation 23 will give a conservative lower bound prediction. For a 14o slope and a L/B of 8 Stewart gave reduction factors of approximately 0.94 and 0.97 for b/B values of 1 and 2 respectively indicating that the slope reduction factor diminishes quite rapidly as b is increased from zero. This is in agreement with the Georgiadis et al, 2013 reductions shown in Figure 18 for b/B = 2.
8. Slope Effects on Deflections and Bending Moments
There is little published information on the effect of slopes on the deflections of laterally loaded piles. Georgiadis and Georgiadis, 2010 plot load versus displacement curves in an analytical parametric study of 1.0 m diameter piles with embedded lengths of 5 m, 10 m, and 20 m and laterally loaded at ground level. The piles were located in level ground and on the crest of 20o and 40o slopes in cohesive soil and were assumed to have a roughness factor, α = 0.5. At yield load levels the ground level displacement of the 5 m long pile (L/B = 5) at the crest of a 20o slope was approximately 50% greater than the pile in level ground. At the ultimate load the displacement was approximately 200% greater than on level ground. (These approximate increases were estimated from plotted curves.)
Experimental and analytical studies by Chae et al show that the maximum bending moment in a laterally loaded pile at the crest of a 30o slope in cohesionless soil is approximately 15% greater than in a pile located at a distance of 4 diameters from the crest. The parametric study results of Georgiadis and Georgiadis, 2010 for the 1.0 m diameter and 5 m long pile in cohesive soil referred to above show a small increase in bending moment from the level ground case to the 20o slope. The increase cannot be easily read from the plotted curves but it is estimated to be less than 5%.
9. Conclusion
Down sloping ground in front of a cantilever pole wall can significantly reduce the lateral load capacity of the pole foundations. For a cohesionless soil with a 30o down slope immediately in front of the wall, the reduction in capacity from a level ground case is a factor of approximately 0.4. The reduction for the same slope in an undrained cohesive soil is approximately 0.7. There is very limited test information to support these theoretical reductions. For design, judgement needs to be exercised in applying the slope reduction factors particularly for the cohesive soil case where a larger reduction (based on a lower bound curve) might be applied for walls of high importance. There is no published information on slope effects in a c-ϕ soil in the wall foundation. For these soils a reduction based on the pure cohesionless and cohesive cases could be used by considering the relative contribution of the friction and cohesion components in the total shear strength.
In cohesive soils lateral load analyses making allowance for a variation in the bearing capacity factor with depth involves the evaluation by iteration of rather complex equations derived from simultaneous solution of the equilibrium equations. Charts have been developed in the present study for both the toe soil yield capacity and pole ground level displacement based on three different assumptions regarding the depth variation of the bearing capacity factor. These provide sufficiently detailed information for design applications.
10. References
Barker P D. 2012. Effects of Soil sSlope on the Lateral Capacity of Piles in Cohesionless Soils. M.S. thesis, Oregon State University, School of Civil and Construction Engineering, Corvallis.
Broms B. 1964a. The Lateral Response of Piles in Cohesionless Soils. J. of Soil Mech. and Found. Eng. Div., ASCE, 90 (3), pp 123-156.
Broms B. 1964b. Lateral Resistance of Piles in Cohesive Soils. J. of the Soil Mech. and Found. Eng. Div., ASCE, 90 (2), pp 27–64.
Bushan K, Haley S C, and Fong P T. 1979. Lateral Load Tests on Drilled Piers in Stiff Clays. Journal of Geotechnical Engineering Division, ASCE, 105 (8), pp 969-985.
Chae K S, Again K, and Wakai A. 2004. Lateral Resistance of Short Single Piles and Pile Groups Located Near sSlopes. International Journal of Geomechanics, 4 (2), pp 93-103.
Gabr M A, and Borden R H. 1990. Lateral Analysis of Piers Constructed on Slopes. Journal of Geotechnical Eng., 116 (12), pp 1831-1850.
Georgiadis K, and Georgiadis M. 2010. Undrained Lateral Pile Response in Sloping Ground. Journal of Geotechnical and Geoenvironmental Eng., ASCE, 136 (11), pp 1489-1500.
Georgiadis K, Georgiadis M, and Anagnostopoulos C. 2013. Lateral Bearing Capacity of Rigid Piles Near Clay Slopes. Soils and Foundations: 53 (1), pp 144-154.
Guo W D. 2008. Laterally Loaded Rigid Piles in Cohesionless Soil. Canadian Geotechnical J., 45(5), pp 676-697.
Hansen B J. 1961. The Ultimate Resistance of Rigid Piles Against Transversal Forces. The Danish Geotechnical Institute, Bulletin 12, 5–16.
Isenhower W M, and Wang S T. 2013. Technical Manual for LPile. A Program for the Analysis of Deep Foundations Under Lateral Loading.
Jeanjean P. 2009. Re-assessment of p–y Curves for Soft Clay from Centrifuge and Finite Element Modelling. Proceedings of 41st Offshore Technology Conference. Houston, pp 2081–2103 [OTC 20158].
Lin H, Ni L, Suleiman M T, and Raich A. 2015. Interaction Between Laterally Loaded Pile and Surrounding Soil. J. Geotech. Geoenviron. Eng., ASCE, 141 (4) 04014119-1 04014119-11.
Matlock H. 1970. Correlations for Design of Laterally Loaded Piles in Soft Clay. Proceedings of the 2nd Offshore Technology Conference. Houston, pp 577–94 [OTC 1204].
Mirzoyan A D. 2007. Lateral Resistance of Piles at the Crest of Slope in Sand. M.S. thesis, Brigham Young University, Department of Civil and Environmental Engineering, Utah.
Motta E. 2013. Lateral Deflection of Horizontally Loaded Rigid Piles in Elastoplastic Medium. J. Geotech. Geoenviron. Eng., ASCE, 139 (3), pp 501–506.
Murff J D, and Hamilton J M. 1993. P-Ultimate for Undrained Analysis of Laterally Loaded Piles. J. Geotech. Eng., ASCE, 119 (1), pp 91–107.
Poulos H G, and Davis E H. 1980. Pile Foundation Analysis and Design, Wiley, New York.
Prasad Y V S N, and Chari T R. 1999. Lateral Capacity of Model Rigid Piles in Cohesionless Soils. Soils and Foundations, 39 (2), pp 21-29.
Reese L C, and Welch R C. 1975. Lateral Loading of Deep Foundations in Stiff clay. J. Geotech. Eng. Div., ASCE, 101 (7), pp 633–49.
Reese L C, Cox W R, and Koop F D. 1974. Analysis of Laterally Loaded Piles in Sand, Proc. 6th Offshore Technology Conference, Paper 2080, Houston, Texas, pp 473-483.
Reese L C, Isenhower W, and Wang S T. 2006. Analysis and Design of Shallow and Deep Foundations, Wiley, New Jersey, USA.
Reese L C. 1958. Discussion of Soil Modulus for Laterally Loaded Piles, by B Mclelland and J A Focht, Jr., Transactions, ASCE, 123, pp 1071-1074.
Reese L C, Cox, W R, and Koop F D. 1975. Field Testing and Analysis of Laterally Loaded Piles in Stiff Clay. Proceedings of the Seventh Offshore Technology Conference, Houston, OTC 2312, pp. 671–690.
Stevens J B, and Audibert J M E. 1980. Re-examination of p–y Curve Formulation. Proceedings 11th Offshore Technology Conference. Houston, pp 397–403.
Stewart D P. 1999. Reduction of Undrained Lateral Pile Capacity in Clay due to an Adjacent Slope. Australian Geomechanics. 34(4), pp 17-23.
Sun K, and Pires J A. 1993. Simplified Approach for Pile and Foundation Interaction Analysis. Journal of Geotechnical Eng., ASCE, 119 (9), pp 1462-1479.
Wood J, and Marchant P. 2021. In Letter to Editor, NZ Geomechanics News, December, pp 16-19.
Wood J. 2021. Cantilever Pole Retaining Walls. NZ Geomechanics News, June, pp 16-60.
Zhang L, and Ahmari S. 2013. Nonlinear Analysis of Laterally Loaded Rigid Piles in Cohesive Soil. International Journal for Numerical and Analytical Methods in Geomechanics, 37, pp 201-220.
Zhang W. 2018. Ultimate Lateral Capacity of Rigid Pile in c-ϕ Soil. China Ocean Eng., 32 (1), pp 41–50.


