ABSTRACT
Following the 2010/2011 Canterbury Earthquake Sequence, thousands of Cone Penetration Tests were carried out to inform geotechnical engineers about soil conditions. Nearly 1000 piezometers were also installed to monitor shallow groundwater. These provided information with unprecedented spatial resolution, and depth to groundwater maps led to greater understanding of liquefaction. In 2016, Christchurch’s groundwater network was rationalised to c.250 sites with transducers logging levels and temperature every 10 minutes. The resulting high-resolution dataset provides a new level of detail on groundwater. It enables generation of tens of thousands of interpolated mathematical surfaces to characterise, spatially, the variability of groundwater and influencing processes.
A similar network was installed in Dunedin during 2019 involving 23 sites, spaced < 1 km apart, where levels and temperatures are recorded at 15-minute intervals. Maps show the elevation and depth of groundwater, extent of tidal forcing, limits of saline intrusion, effect of rainfall recharge, position of infrastructure relative to the water table. Geometric models of sea level rise account for both tides and water table geometry.
Data from both cities highlight the dynamic and spatially variable response of shallow groundwater to drivers such as rainfall, surface runoff, tides, and even evapotranspiration. Groundwater levels impact on flooding hazard, liquefaction potential, city stormwater and wastewater infrastructure, and data can be used to model the spatial impact of sea-level rise. But the variation in shallow groundwater levels in coastal systems is subtle, so minimising uncertainties is crucial and requires precise surveying, careful pressure corrections and regular field calibration.
BACKGROUND
Our naturally evolving climate has been radically influenced by humans and the changes are about to have some very profound effects on where, and how, populations can exist. The global picture that climate is changing and sea-level is rising now seems reasonably well-established, albeit bound by a wide range of uncertainties. There are probabilistic models of global sea-level rise and national climate scenarios that are constantly improving. The exact nature of local effects, however, are far less clear, and there are significant challenges and problems associated with downscaling from global to regional to local models.
Downscaling involves a shift from general probabilistic scenarios to a deterministic understanding of where and how often the effects will be felt. It requires holistic understanding of natural systems and the processes that can perturb their present state. Local (cf. global) processes and impacts of climate change and sea-level rise are for the most-part still poorly quantified/understood, with significant temporal (frequency) and (perhaps more importantly) spatial uncertainty in the hazards faced across our communities. Understanding the intensity and spatial reach of hazards, and how various hazards interplay, is becoming an expectation for planning and mitigation. It will be increasingly important in the near-future, but requires significant science investment and lead-in time from research to practice. Here we describe exemplars where recent developments in groundwater monitoring and modelling have improved both spatial and temporal understanding of hazards associated with shallow coastal groundwater.
GROUNDWATER HAZARDS
Shallow groundwater presents a largely unseen, and poorly-understood, hazard with potential to affect multiple domains and sectors in a cascading and cumulative manner (MfE 2017). In low-lying coastal areas where there are strong hydraulic links with the ocean, rising groundwater is expected to be driven by sea level rise. By decreasing the unsaturated ground available to store water, groundwater rise will increase the frequency of hazards associated with surface runoff, river flooding and coastal-storm inundation. More directly, it causes instability in building foundations and roads, can infiltrate into and overwhelm stormwater and wastewater systems, leads to dampness and mould issues in housing, increases liquefaction potential, and can emerge above ground to cause flooding, pollution, salinity stress or other environmental issues. Subsurface stormwater and wastewater networks are vulnerable and potentially-prone to damage and system collapse. Groundwater infiltration reduces network capacity and can result in sewerage overflows, with associated public-health and environmental costs.
Shallow groundwater in New Zealand coastal areas typically sits above mean sea-level, perched in a marine-sediment aquitard over denser saline water (e.g. van Ballegooy et al. 2014). There are large variations in permeability between relatively-porous coastal sand-dunes, silt-dominated estuarine and marine sediments, and gravel- and sand-rich alluvial sediments. The coastal groundwater systems are also dynamic. Groundwater levels fluctuate considerably with inter-annual and seasonal shifts as well as higher-frequency variations caused by storm-events, local river floods or tidal cycles. The groundwater system can, additionally, be perturbed by changes in precipitation that may result from climate-change as well as the persistent stressor of rising sea-level. Because the water table is modulated by the sea, low-lying areas potentially affected by rising groundwater can extend considerable distances inland. But analysis of vulnerability to groundwater-related hazards is hampered by a widespread lack of groundwater information within coastal land. Such areas are rarely monitored or studied in detail principally because shallow coastal groundwater is commonly unsuitable for domestic or agricultural supply. It is often assumed that groundwater levels will equilibrate locally with sea-level and simplistic ‘bathtub’ models propagate groundwater through digital terrain models using GIS techniques (e.g. BECA 2014, PCE 2015). Such first-order approximations are useful for general desk-top assessments of regional asset exposure but reflect little of the principles of hydrogeology and the dynamics of subsurface flow.
A significant problem faced by society is the cost-benefit return of continued investment, or otherwise, in infrastructure as groundwater rises. To fully quantify the risk and exposure of assets to hazard, there needs to be improved understanding of inundation magnitude, frequency and duration. With large infrastructure redesign/renewal imminent under the Three Waters programme (TWP 2020), research will be needed to inform and optimise investment decisions New Zealand-wide. At what stage do we switch from defence to managed retreat? Can we predict critical groundwater levels at which networks will experience major step changes in efficiency or even catastrophic collapse in performance? Investment in groundwater monitoring and science to characterise drivers of the natural fluctuations and groundwater behaviour in coastal areas is a logical first step as it can provide maps of probability and duration of inundation exceedance against local geology, distance from the coast and surface water inputs.
CHRISTCHURCH
Spatial Precision
Mapping of the shallow groundwater table in Christchurch is an example of science where decreasing spatial and temporal uncertainties has resulted in a major evolution of our understanding of local groundwater. Following the 2010-2011 earthquakes, a network of shallow monitoring piezometers was installed for geotechnical purposes (Figure 1). Initial models generated with 806 piezometers had subtle differences depending on whether only sites with longer-term (>9 months) records were used, or a larger dataset that included <9 month records with proxy values inferred for annual variability (van Ballegooy et al., 2013). A statistically more-robust version (van Ballegooy et al., 2014) used median values from 967 monitoring piezometers over a longer-period accompanied by statistical surfaces (e.g. 15th & 85th percentiles) to account for the range of seasonal fluctuations. Depth to water level models were determined by subtracting water table elevations from LiDAR surveys of land elevation.
The large number of piezometers and new LiDAR data enabled groundwater elevation to be mapped in Christchurch with unprecedented spatial resolution. Only a small subset (44) of piezometers, however, had continuous records through the earthquake-cycle with extended long-term (>20 year) decadal records. Data from these piezoemeters generated questions as to the influence of earthquakes on the water table, highlighted the occurrence of inter-annual variation, and raised issues around long-term climatic trends. In addition, since water table surfaces at each site were based on statistics over a period of ~3 years, the maps were not instantaneous measures of the potentiometric surface at any one time, so could not be assumed to be valid indicators of the gradient and direction of groundwater flow. Although the spatial density of water table monitoring in post-earthquake Christchurch far exceeded anywhere else in New Zealand at the time and is likely to be amongst the most-extensive of any cities in the world, the water table mapping provided for earthquake recovery was accompanied with strong caveats around temporal uncertainty.
Temporal Precision
Investment into shallow groundwater monitoring in Christchurch was rationalised by the Earthquake Commission (EQC) in late 2016, when manual dipping (then at 967 sites) was replaced with automated pressure transducers at ~250 sites. Although spatial resolution was decreased, the new network measuring both temperature and pressure at 10 min intervals provides a step change in temporal resolution.
Data spanning 24/09/2016-4/09/2017 has been processed by John Haines (GNS Science) into a series of movies with 5516 instantaneous surfaces, 1.5 hours apart, to characterise relative elevation, rate of vertical change and horizontal gradient of the water table, as well as absolute temperature and rate of groundwater temperature change.

Figure 1: Maps of Christchurch and Dunedin at the same scale, showing the density of groundwater monitoring overlain on blue-shaded grid models of the depth to water table (after van Ballegooy et al. 2014, Cox et al. 2020).
Statistical damping of data over different time-steps highlight fluctuations caused by tidal, rainfall and seasonal forcing. Recharge from rainfall and rivers, cyclones Debbie (5/04/2017) and Cook (14/04/2017), and spring tides clearly influenced groundwater during 2016-17. The movies provide a unique and unparalleled visualization of Christchurch’s shallow groundwater system.
DUNEDIN
The City of Dunedin has a large number of assets and critical infrastructure that are situated at, or close to, sea level. Presently protected by a slightly elevated margin of reclaimed land and fragile sand-dunes, the flat-lying coastal land, particularly in South Dunedin, is crucial to present functional operations of the city. The land is also underlain by shallow groundwater, which limits the amount of unsaturated ground available to store rain and runoff, limits drainage space and creates opportunities for infiltration into stormwater and wastewater networks. Although groundwater levels are expected to increase throughout New Zealand coastal areas in response to sea level rise, groundwater beneath Dunedin’s narrow coastal strip is faced with encroachment from all directions: the harbour in the east, the ocean in the south, and expected changes to runoff- and recharge-related flows from hill catchments in the north and west. For simple geometrical reasons of its geography, Dunedin’s challenge appears particularly demanding.
New Monitoring Data
A groundwater monitoring network improvement in 2019 provides a significant level of new information on Dunedin’s groundwater. Water level, temperature and conductivity observations at 23 sites are recorded at 15 min intervals (Figure 1), then collated into a time-series database hosted by Otago Regional Council (ORC). A recent report describes the first year of observations with a focus towards the spatial analysis of these groundwater data (Cox et al. 2020). A variety of statistics have been generated for each monitoring site, including median, maximum, minimum, 95th and 5th percentiles, mean, standard deviation and range of groundwater levels from 6/03/2019-12/2/2020. Other collated site data include: tidal amplitude, efficiency and phase lag; distance from harbour or sea; sample pH, electrical conductivity and modelled seawater percentage; and a rainfall response index reflecting rainfall recharge efficiency. Site data were reviewed relative to each other as a series of points, and/or interpolated into grids representing the 8.9 km2 area of the flat-lying coastal land.
Groundwater throughout South Dunedin is unconfined, but there is a locally perched aquifer in dune-sand at St Kilda, and some semi-confined horizons in the Harbourside area. Levels during 2019 were dominated by rainfall-related peaks and recessions, were slightly lower during late summer-early autumn, and contain subtle tidal-related cycles (Cox et al. 2020). Movies developed by Peter Johnson and John Haines (GNS Science) are a useful way to visualise the tidal and rainfall-related fluctuations and their spatial reach. Data from four longer-term ORC monitoring sites indicate the 2019 observations are a reasonable proxy for average conditions during the previous decade, but some of the extreme levels experienced during that decade were not experienced by the new network.
Water Table Position & Behaviour
Grids of water table elevation (GWL) and depth to groundwater (DTW) were developed from piezometer observations, constrained at the harbour and coast using a series of boundary ‘control points’ (Figure 2A,B; Cox et al. 2020). These ‘statistical surfaces’ approximate the potentiometric pressure and condition of groundwater over extended periods (e.g. long-term hydraulic gradients) and are suited for engineering, such as foundation design and probabilistic assessment of liquefaction vulnerability. By way of contrast, ‘static surfaces’ or ‘event related surfaces’ are needed for characterising short-term behaviour (e.g. directions and velocity of flow). Depth to water grids, derived relative to a LiDAR survey of topography, highlight that the position of the water table relative to ground and associated vulnerability does not necessarily reflect topographic elevation (Figure 2C). The lowest lying suburbs do not necessarily coincide with shallowest groundwater. Instead, the water table has elevation and gradient that is variable at kilometre-scales, with important differences from suburb to suburb.
Groundwater adjacent (< 1 km) to the coast has specific electrical conductivity interpreted to reflect saline intrusion and sea-water mixing (Figure 2D). Three sites have strong, regular, tidal fluctuations at 30-51% of the nearby harbour or ocean tides. Elsewhere, tidal influence is weak (0.1-1% efficiencies at <1.6 km) or undiscernible with lags up to 360 minutes behind the harbour or ocean tide. Tidal efficiencies were mapped and interpolated for use in sea rise models (Figure 2E). Weak tidal responses and substantial time-lags are indicative of the low bulk diffusivity of the sediment.
Groundwater response to rainfall has been characterised using a rainfall recharge index (RRI), being the ratio of groundwater level change to local rainfall event total, based on selected medium-sized storms (Figure 2F). Values are spatially variable from site to site depending on factors such as local stormwater drainage and other infrastructure, extent of ‘hard’ urban surfaces creating ground imperviousness, piezometer construction method and head protection, or subsurface sediment storativity and permeability. There are some hints at temporal variability that could potentially play a role in whether heavy rain events do, or do not, cause flooding. But further work is needed to understand the relative effects of pre-event groundwater level, rainfall duration and intensity, and stormwater network performance.
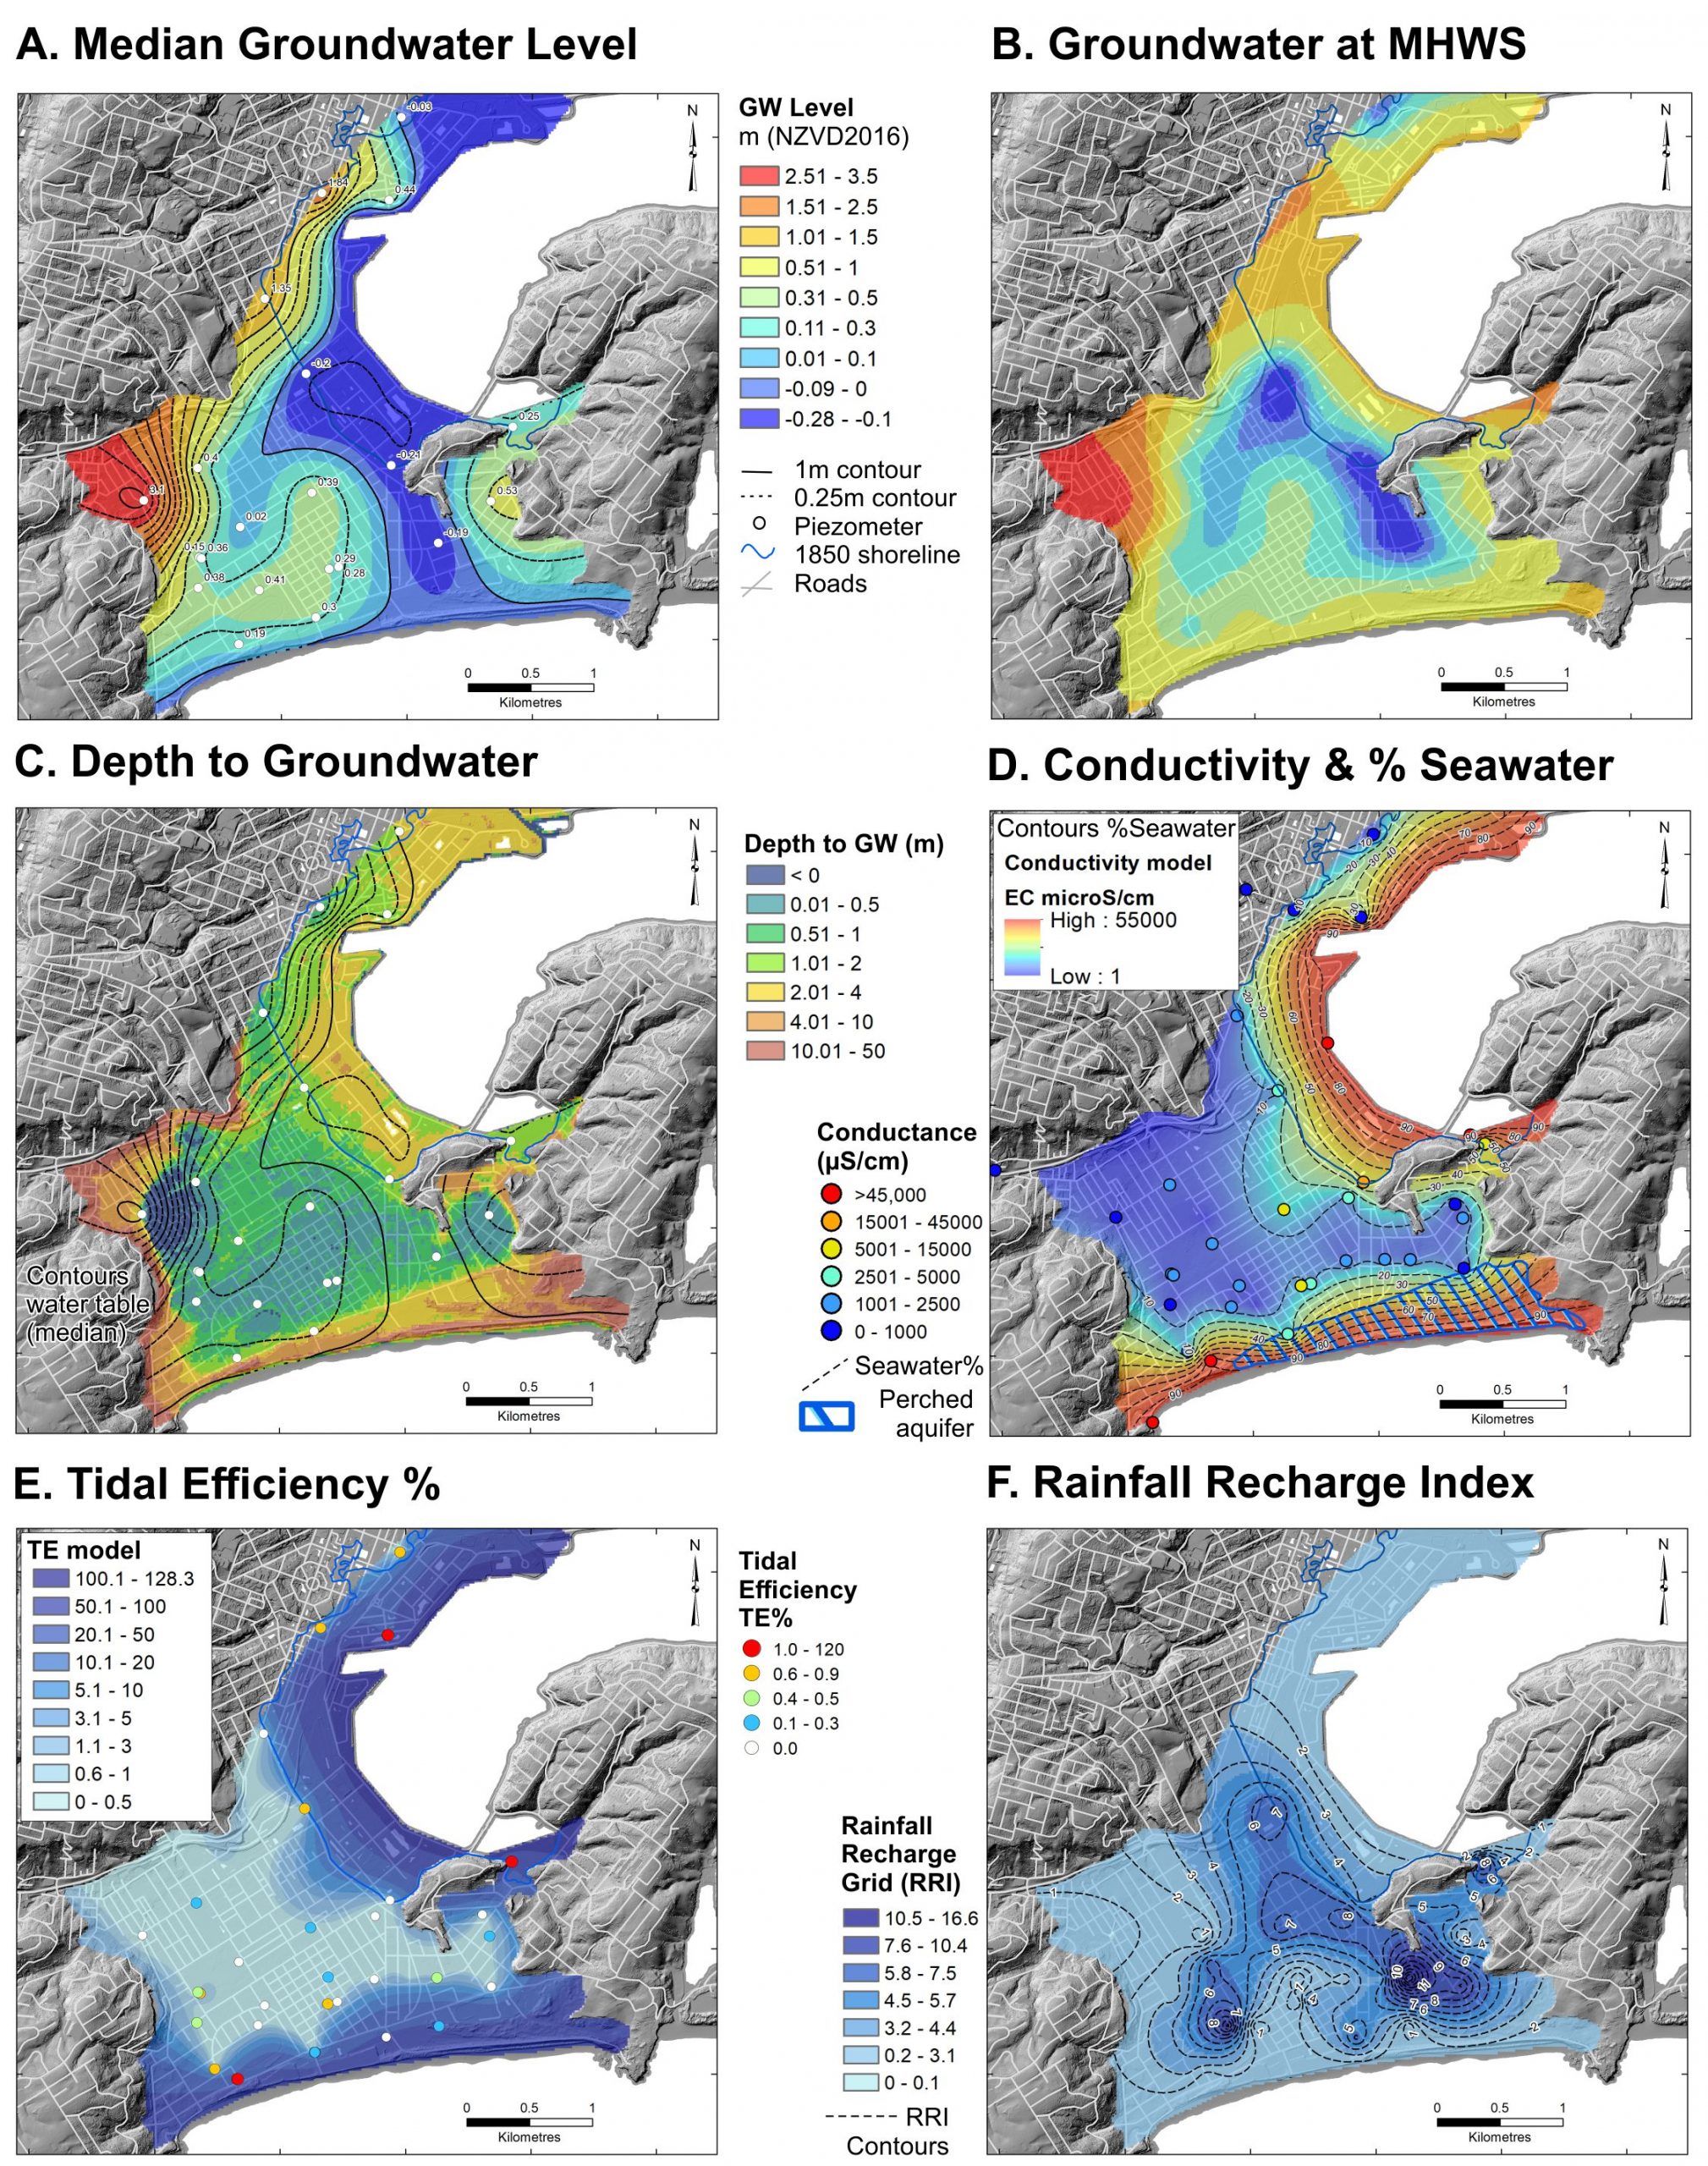
Figure 2: Selection of geometric models depicting groundwater dynamics in Dunedin (from Cox et al. 2020): A. The elevation of the 2019 median level of groundwater (in NZVD2016). B. A model of groundwater level at mean high water springs, based on a median value for 2019. C. Depth to groundwater relative to the LiDAR model of ground surface height, with contours marking the median groundwater elevation. D. Specific conductivity of groundwater showing the extent of saline intrusion as a modelled % seawater contour. E. Tidal efficiency (in %) as the ratio of the groundwater tidal amplitude to the nearest sea (ocean or harbour) tidal amplitude. F. Rainfall recharge as the ratio of groundwater level change to total rainfall.

Figure 3: Geometric models depicting A. the position of Dunedin’s stormwater network (pipes and invert levels) relative to groundwater at mean high water springs. Blue areas are where the network locally is below groundwater. B. Groundwater at mean high water springs after 30cm of sea level rise, based on the geometry of median levels and tidal efficiencies measured in 2019. For further details see Cox et al. (2020).
Infrastructure & Sea Level Rise
Large parts of Dunedin’s wastewater and stormwater networks lie at or below the water table and are vulnerable to infiltration (OPUS 2011). Saltwater intrusion into wastewater pipelines has been an ongoing concern as the salinity affects secondary treatment. The likely implications of climate change and sea-level rise, (with associated increased rainfall intensity, storm frequency and rising groundwater) is an elevated level of groundwater infiltration and other inflow, which decreases system efficacy. GIS datasets have been generated that identify places where the network sit relative to the water table, including places where infiltration might switch to exfiltration with groundwater fluctuations (Figure 3A). The analysis provides a geometric tool to target future monitoring aimed at identifying thresholds for groundwater-network exchanges in relation to network mains’ flows, age, material and construction methods.
Simple geometric models to depict how sea level rise will affect groundwater have been developed using the present-day statistical surfaces (e.g. Figure 3B). At their simplest, the models assume the absolute position of Dunedin groundwater will also rise and that the shape of the water table in the future will be, on average, the same as at present. By taking the mapped position of groundwater into account, the geometric models are quite distinct from ‘bathtub models’ that assume a horizontal groundwater surface that is everywhere equilibrated with mean sea level. The geometric models are strongly empirical with many caveats and implicit assumptions. They simplify many variables and controlling processes into a single parameter, and do not account for groundwater flow and possible changes in water-budget mass balance.
Scenarios have been developed for a range of sea level rise increments (30, 50 and 80 cm) (Cox et al. 2020). To incorporate the influence of tides, and the decayed signal with distance away from the harbour and coast, a tidal component was added based on present day observations of tidal efficiency. The geometric models show progressive changes to the water table position exacerbated by encroachments from east, south, west and north, and highlighting the threat faced in Dunedin due to its geography (Figure 3B cf. Figure 2B).
SUMMARY & CONCLUSIONS
Christchurch and Dunedin are constructed on coastal land underlain by shallow groundwater, where hazards such as liquefaction and flooding vary with seasonal and inter-annual variability in groundwater levels, and potentially with responses over even shorter time-scales. Both cities are vulnerable to sea level rise but Dunedin’s challenge seems particularly demanding due to the amount of infrastructure on a narrow coastal plain that will be encroached from both the harbour and the ocean. A valuable lesson from both case studies is that the subtle slope and shape of the water table, which has gradient variability at kilometre-scales even in a seemingly very flat low-lying area, interacts with land-surface topography to generate marked differences in the depth to groundwater. These suburb-scale variations in the position of groundwater and availability of subsurface storage are likely important for engineering solutions for habitable land use. The groundwater-related datasets provide a tool from which inundation- or flood-vulnerable areas can be identified, and other hazards such as liquefaction susceptibility modelled. Future needs that can also be informed by such data include real-time integration of groundwater level data into flood modelling and management, ground-source heat resources, contaminated site plumes and time-varying liquefaction prediction. They also enable monitoring to be targeted on key areas of groundwater-network exchange, so that hazard thresholds and any critical tipping points that might lead to infrastructure system collapse can be predicted. The fluctuations and controlling influences on shallow coastal groundwater can be subtle, however, so it is critical to minimise uncertainties with fit for purpose networks, precise surveying, careful pressure corrections and regular field calibration.
References
BECA 2014. Assessment of Options for Protecting Harbourside and South City from Direct Impacts of Sea Level Rise. Report for Dunedin City Council. Beca Ltd. July. 2014. 41 p.
Cox S.C., Ettema M., Mager S.M., Glassey P.J., Hornblow S. & Yeo S. 2020. Dunedin groundwater monitoring and spatial observations. Lower Hutt (NZ): GNS Science. GNS Science Report 2020/11. doi:10.21420/AVAJ-EE81.
MfE 2017. Coastal Hazards and Climate Change: Guidance for Local Councils. Wellington: Ministry for the Environment. Published 2017. ISBN: 978-1-98-852535-8. 279 p. + Appendices (83 p.).
OPUS 2011 Integrated Catchment Management Plans 2010-2060. Phase 1 Wastewater System – Final Report Contract No. 2993 Dunedin 3 Waters Strategy. Report by OPUS International Consultants Ltd. and URS NZ Ltd. for the Dunedin City Council 113 pages + 9 appendices.
PCE 2015. Preparing New Zealand for rising seas: Certainty and Uncertainty. Parliamentary Commissioner for the Environment. 93 p.
TWP 2019. Three Waters programme. https://www.dia.govt.nz/Three-waters-review. Last accessed 25/11/2019.
van Ballegooy S., Cox S.C., Agnihotri R., Reynolds T., Thurlow C., Rutter H.K., Scott D.M., Begg J.G. & McCahon I. 2013. Median water table elevation in Christchurch and surrounding area after the 4 September 2010 Darfield Earthquake. GNS Science report 2013/01. 66 p + 8 appendices.
van Ballegooy S., Cox S.C., Thurlow C., Rutter H.K., Reynolds T., Harrington G., Fraser J. & Smith T. 2014. Median water table elevation in Christchurch and surrounding area after the 4 September 2010 Darfield Earthquake. Version 2. GNS Science report 2014/18. 79 p + 8 appendices.
Acknowledgements
Groundwater monitoring is carried out by EQC, Christchurch and Dunedin City Councils, Environment Canterbury and Otago Regional Council, amongst others. Much early work in Christchurch was led by Tonkin & Taylor. Dunedin’s monitoring was supported by QuakeCoRE (University of Canterbury), Oceana Gold, University of Otago, Golders Associates and McNeill Drilling. The authors also acknowledge support of many colleagues and collaborators, in particular: , Sjoerd van Ballegooy (Tonkin & Taylor), Marc Ettema and Sharon Hornblow (ORC), John Haines and Peter Johnson (GNS Science). This paper was in-part funded by the Urban Groundwater project (GNS Science’s Strategic Science Investment Fund) and the NZSeaRise Programme (an Endeavour programme funded by the Ministry of Business, Innovation and Employment led by Victoria University of Wellington). It was improved by comments from Peter Johnson, Malcolm Arnott and anonymous peer review.