
Abstract
The geotechnical behaviour of natural pumiceous soil deposits is highly dependent on the percentage of highly crushable pumice particles to hard-grained sands, within the soils matrix. There is currently no standardised method to quantify the pumice content of a given soil sample. The research and laboratory testing outlined in this paper was initiated with the purpose of forming a standardised methodology to do just that. This paper explores one method by which the amount of pumice in naturally occurring pumiceous sand deposits can be estimated. The method makes use of the high crushability of pumice grains, compared to hard-grained sands, in correlation with some particle breakage indices based on particle size distributions (PSD) of a soil sample prior to and after testing. In order to standardise the crushing of the soil sample, a modified version of the standard proctor test outlined in NZS 4402.4 was adopted. Extensive testing was undertaken to determine a compaction energy that would result in significant crushing of pumice grains, with minimal crushing of hard-grained sand particles. Testing concluded that a compaction energy of 900 KJ/m3 was optimal for the final methodology. To determine if there is a correlation between some particle breakage indices and the pumice content of a soil, soil samples were prepared by mixing Mercer River sands and pumice sands. The samples ranged from 0 percent pumice to approximately 100 percent pumice, stepping up in intervals of 25 percent. Multiple samples at each pumice percentage were sieved, tested and then sieved again to build a range of data. From the data collected, an analysis was conducted to determine which breakage index would yield the most reliable relationship. The results of the analysis showed that Relative Breakage (BR), theorised by Hardin (1985), was most appropriate for the final methodology.
1 Introduction
Pumice is a volcanic material that forms during volcanic events. During the initial eruption, magma erupts at such great speeds that it forms a molten froth. As this froth travels through the air it is rapidly cooled. During this cooling gasses get trapped in the froth, forming vesicles, or pores. Due to this rapid cooling, the atoms in the material are unable to form into a crystalline structure.
Pumiceous deposits in the central part of the North Island, New Zealand are generally encountered in river valleys and flood plains; these areas typically coincide with large areas of development and human inhabitants (Orense et al. 2012). These widespread pumiceous soil deposits around the Volcanic Plateau are the product of massive volcanic eruptions occurring in the Taupō Volcanic Zone (TVZ), shown in Figure 1 below. The TVZ is responsible for a majority of New Zeeland’s volcanic soil deposits. The zone extends from White Island to Ruapehu and is considered extremely active. Volcanic soils have been deposited over approximately one-sixth of the North Island during the last 1.5 million years by events in this zone. Particularly large amounts of hot ash and pumiceous materials have been deposited by huge eruptions of the Taupō, Okataina and Rotorua volcanoes, over the last few thousand years. During these events, pumiceous soils were initially deposited over the land via airborne transport, and were later transported many kilometres away via soil erosion and river deposit (Kikkawa et al. 2012; Wesley 2001).

Cone Penetrometer Testing (CPT) is a common test that is used to estimate the engineering properties of soil. Testing involves pushing a cone through the soil and measuring it’s tip resistance, pore water pressure, and sleeve friction. From these measured data, other engineering properties of the soil are estimated, such as the liquefaction resistance, i.e. cyclic resistance ratio (CRR). Correlations made between CPT data and soil characteristics have largely been modelled from tests involving more common soils, such as non-crushable silica sand deposits. During CPT testing the shear stress transfer from the cone to soil can result in crushing of pumice grains. This localised crushing results in the formation of finer grained material, of which the mechanical properties can vary greatly from the in-situ material. Therefore, the conventional relationship of tip resistance, relative density, and cyclic resistance do not apply to pumiceous soils (Orense et al. 2012). In addition, laboratory testing indicates that the response of natural pumiceous sands is dependent on the pumice sands present in the soil matrix.
2 Literature Review
2.1 Engineering Properties of Pumiceous Soils
Pumice is typically characterised as lightweight and crushable. These defining characteristics are due to the porous nature of the pumice. Each individual pumice particle has an inter-connected network of external voids/vesicles, as well as internal vesicles. The individual particles of pumice are easily crushed between one’s fingers. The high crushability results from two factors: the vesicular and angular structure of the particles. Pumice sands are typically 75% by weight of silica sands. The structure of individual pumice grains can be seen in Figure 2 below.

Wesley (2001) has led investigations into quantifying the specific gravity of pumice sands, and the effects of particle size. He carried out two different methods to determine the soil’s specific gravity: (1) using simple displacement methods, and (2) putting the soil under vacuum. He noted a substantial difference in specific gravity results between the two tests for all particle sizes. This likely arises due to the water not penetrating the external voids of the pumice particles when not under vacuum. He observed that even when the particle size was as small as 0.04 mm, there were still internal voids of which water could not penetrate. The average specific gravity from his testing came out at 1.77, which is considerably lower than that of quartz sand at 2.65. He found that pumice particles ranging from 0.0063 mm to 2.0 mm have a relative density of approximately 890 kg/m3, with a max dry density of 955 kg/m3 (Wesley 2001).
2.2 Response of pumiceous soils during seismic event
During the 1987 Edgecumbe earthquake, widespread liquefaction was observed. Liquefaction resulted in vertical settlements, lateral spreading and sand boils across the Rangitaika Plains. The Rangitaika Plains soil profile typically consists of alternating layers of pumice-derived alluvial sand and gravel, with interbedded greywacke gravel, tephra, marine silt, and sand. The groundwater in this area is generally around 3 m below the surface. At some of the sand boil sites, the ejected soil consisted of stratified, fine to medium-grained sands with pumice lapilli of up to 20 mm in diameter (Pender and Robertson 1987).
2.3 Soil compaction and crushing
In the New Zealand Standard NZS 4402.4, there are two compaction tests outlined: the Proctor Test and the Modified Proctor Test. Both tests involve layering a soil sample into an apparatus of a given dimension, to a standard number of layers; followed by a hammer weight dropped from a standard height, weight, and a number of blows. This results in the compaction of the soil.
It was found in research by Luxford (1975) that these tests are not suitable for a cohesion-less material, such as sand or coarse-graded stones. This is due to the inherent angular stability of these materials. Further adding to this, Arcement and Wright (2001) found that compaction of fine soft sands would undergo crushing, whereas weathered silica sands could withstand the test.
2.4 Soil breakage potential indices
Soil breakage refers to the physical degradation of a soil particle or grain, through applied force. The deformation response of soil is highly dependent on the soil’s ability to withstand high loads, and not undergo significant particle breakage (Hardin 1985). The degree of particle breakage is dependent upon the stress path, time and magnitude of loading. More particles will crush when a large load is applied over an extended period. However, the rate of crushing will gradually lessen. This is due to the grading of the soil particles becoming finer and less crushable under loading. Furthermore, the structure of the particle influences the breakage potential. Pumice particles have an angular, porous structure that results in high crushability, whereas hard grained quartz and silica sands have a round structure and do not crush easily. Simply, the greater the relative density, the less the potential for crushing (Lade et al. 1996).
The degree of particle breakage can be defined by comparing the particle size distribution (PSD) curves before and after loading. The PSD of soil shows the proportion of variable particle sizes contained in a soil sample. Several geotechnical engineers have theorised what is known as a ‘particle breakage index’. In all theories, the index makes use of a particle size distribution curve; where the PSD is taken both before and after the crushing of a soil sample. Most of the breakage indices, such as Bp (Marsal 1967), B10 (Lade et al. 1996) and B15 (Lee and Farhoomand 1967), indicate breakage through a singular index based on PSDs before and after crushing. However, relative breakage (BR) by Hardin (1985) looks at the entire PSD curve (Ghanbari et al. 2013).
Marsal (1967) based his breakage measure around the percent of soil retained in each sieve before and after crushing. The difference in percentage retained is calculated at each sieve size and for every positive percentage change the differences are summed, giving the breakage index Bp. Marsal’s index has a theoretical lower and upper limit of 0 and 100%. Lee and Farhoomand (1967) proposed a similar measure, where their particle breakage potential index is expressed in terms of the change in particle diameter, specifically the 15% finer curve before and after crushing. This is the ratio of D15i to D15f, where D15i represents the diameter for which 15% of the sample was finer initially, and D15f represents the diameter of 15% finer after crushing. Lade et al. (1996) later came up with a similar index, using the percentage change at the 10% passing sieve after crushing.
Comparative to these indices, Hardin (1985) proposes a more global index, looking at the entire PSD curve and the potential for particle breakage to a defined state. He defined three parameters, the first being the Breakage Potential (Bp), the area between the initial distribution curve and the number 200 sieve. Breakage potential is representative of the total change in gradation when every single particle is crushed down from its initial grain size to a size lesser than the number 200 sieve. Secondly, he defined the total breakage (BT) as the area between the curve before and after crushing. Finally, he states that the relative breakage (BR) is the ratio of total breakage to potential breakage (Hardin, 1985).
![]() (1)
(1)
The lower limit of his relative breakage is 0, and the theoretical upper limit is 1, representing the zero crushing and full crushing of all particles, respectively. Potential particle breakage (Bp) and total breakage (BT), as described by Hardin (1985).
3 Testing Methodology
3.1 Soils used and Testing Procedure
The soils used in testing were combinations of commercially available Mercer River sands and pure pumice grains. The pumice used in testing has been sourced from the Waikato River and separated from other minerals using a centrifuge. Five sample combinations were used for testing, ranging from 0% pumice to 100% pumice, increasing at increments of 25%. The division of each sample was based on the soil weights, rather than volume. This was done due to the difference in the relative density of the hard-grained, quartz sands and the pumice. All samples used for testing are that of sand grain sizes, ranging from 0.063 mm to 2 mm.
3.2 Testing procedure
The testing methodology was designed to find a trend between the particle breakage of a given soil sample, and the percentage of pumice within the sample. Particle breakage of a soil sample was achieved following the proctor compaction test procedures, outlined in the New Zealand Standards for soil testing NZS4402. Due to having a limited supply of pumice particles for testing the smaller, Japanese Proctor mould, sized in accordance with JIS A 1210:2009 was used. This mould was adopted as it has a smaller volume than the standard NZS4402 mould and would subsequently use less soil. This method of crushing was adopted to control the amount of particle breakage, through changing the compaction energy of testing. The compaction energy can be controlled by varying the height of the drop and number of drops of the hammer, using the standard 2.5 kg proctor hammer. To quantify particle breakage, the most reliable breakage index was determined based on the PSD curves before and after soil crushing. The PSD curve of a soil sample is determined following the procedure outlined in NZS4402:2.8, method for dry sieving. Wet sieving was not adopted due to time constraints for testing.
4 Results
4.1 Compaction Energy
The final testing method was chosen based on a compaction energy that would result in minimal crushing of the sand, and significant crushing of the pumice. Multiple tests were conducted on pure pumice and sand samples to find the optimal compaction energy. Compaction energy, per unit volume, was calculated using drop height (H), hammer weight (W), number of layers (Nl), number of blows (Nb), and the volume of the sample (V), shown in equation (2).
![]() (2)
(2)
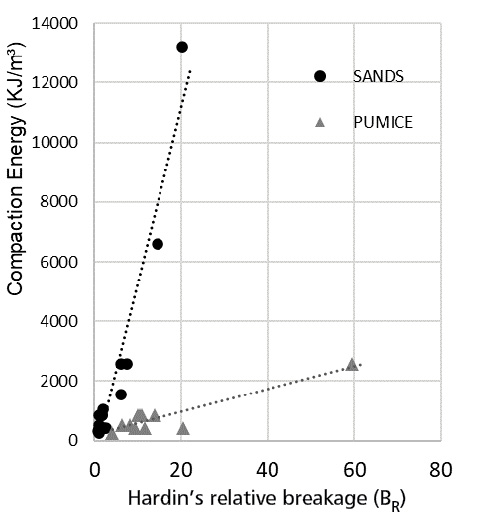
It was found that for compaction energy of 900 KJ/m3 there was some sand crushing, however, the crushing was negligible in comparison to that of the pumice grains. This compaction energy is considered ‘optimal’ for the testing methodology of this paper, with the amount of sand particle breakage considered inconsequential. This is shown in Figure 3, where it is seen that as the compaction energy increases, the relative breakage of pure pumice increases at a significantly higher rate than that of the silica sand the optimal compaction energy was achieved using a 2.5 kg hammer from a drop height of 305 mm with 3 layers of soil with 3 blows of the hammer.
4.2 Particle Breakage Index
Once the final testing methodology had been determined, testing was conducted on samples of known pumice contents. As expected, when using the optimal compaction energy there was significant crushing of the pumice grains relative to the crushing of the hard-grained sand particles. To visualise the degree of particle breakage, PSD curves were used. Figure 4 shows the change in PSD of a soil sample consisting of 100% pumice grains.

5 Discussion
Using the ‘optimal’ compaction energy, physical degradation of pumice particles relative to hard-grained sands was visualised on the PSD curves from before and after crushing. Of the several breakage indices investigated, only Hardin’s BR was deemed accurate and reliable for quantifying a relationship of pumice content and particle breakage. The relationship of BR to pumice content, as percent by weight, can be seen in Figure 5. A total of 15 soil samples, three at each specified pumice content, were tested using the final methodology to produce this trend. Tests at each percentage were performed by independent parties in order to negate any user bias. It can be observed from Figure 4 that samples of 100 percent Mercer sand experienced some crushing. However, this is minor relative to the crushing of 100 percent pumice, resulting in insignificant change to the overall trend.

It was observed during testing that the change in particle distribution after crushing was minor, as shown in Figure 4 above. As a result, the breakage indices that focus on singular point changes of the PSD plot did not yield strong relationships. These indices, comprising Lee and Farhoomand (1967) and Lade et al. (1996), do not consider the entire PSD curve, hence problems can arise when a soil with poor PSD is tested. The effect of poor PSD grading can result in significant crushing of the larger particles with insignificant crushing of the smaller particles. Therefore, when using both the Lee and Farhoomand (1967) or Lade (1996) index, there is the potential to ignore a region of considerable particle breakage. These regions arise from the large particles having a higher potential to crush comparative to smaller particles (Hardin 1985).
Another breakage index that returned a strong relationship between pumice content and particle breakage was Marsal’s (1967), breakage potential(Bp). This refers to the breakage potential of the soil and is the sum of all positive changes in percentage passing at each sieve (Marsal, 1967). Although this index produced a strong trend, due to the dependency on particle distribution and sieve size, it was not chosen for the final methodology. Therefore, Hardin’s BR was chosen for the particle breakage analysis. By using this index, it provides higher accuracy when conducting the test with sieve sizes that differ from those used during experimental testing. Furthermore, variation in results due to samples varying in size, grain size and distribution will be eliminated, as BR is independent of the PSD (Hardin, 1985).
Hardin defines BR upon the assumption that after some period of loading all soil particles will be crushed to the point there is 100% passing the number 200 sieve. In a more recent study by the Einav (2007), he postulates that Hardin’s theory of 100% crushing is inaccurate. He proposed that the particles would not undergo full crushing, but rather would crush until a certain point and after this would not degrade any further, no matter the extent of force applied. This is due to the cushioning effect of surrounding smaller particles and the lack of concentrated stress from force dispersion amongst the smaller particles. Through his research, he was able to define an equation for a boundary line to which all particles would crush. This boundary is comparable to the PSD profile of the pre-crushed soil and is defined as the ultimate breakage (Fu). Similar to Hardin’s method, using this boundary line one could determine the relative particle breakage through the ratio of total breakage and breakage potential (Einav, 2007).
6 Conclusions and Research Recommendations
There are widespread pumiceous soil deposits through the central north island of New Zealand. These soils are problematic for engineers due to the difficulty in accurately measuring the in-situ mechanical properties of the soil. Particularly the cyclic resistance ratio (CRR) derived from data collected during CPT testing. This in-accuracy is due to the high crushability of the pumice particles within these soils.
Through research and laboratory testing, a reliable methodology was made. The methodology accurately determines the pumice content, as percent by weight, of naturally occurring pumiceous deposits comprising hard-grained sands and pumice particles.
Testing showed that the presented method could be completed in a reasonable timeframe, with standard geotechnical laboratory equipment and minimal training. A high degree of repeatability was observed during testing.
Pumice sands were proven to be highly crushable, comparative to hard-grained, silica sands. By crushing samples of pure silica sand and pure pumice sands, an ‘optimal’ compaction energy of 900 KJ/m3 was determined. This energy resulted in significant crushing of pumice particles, with only minor crushing of sand particles. The degree of sand crushing was proven to have minimal effect on the overall accuracy of the testing methodology.
Hardin’s relative breakage index (BR) proved to yield a strong relationship to the percentage of pumice in a given soil sample. Hardin’s BR was deemed to be the most reliable over others investigated due to the independency from the PSD of the soil.
The relative breakage theory proposed by Einav (2007) appears to have higher theoretical practicality over Hardin’s index. Further research should be carried out into this theory and its application to the methodology proposed in this paper.
It was observed during testing that some of the finer soil particles following crushing would get stuck in the sieves. This may cause some irregularities in the test results, as a PSD curve is very sensitive to weight change in the lower sieve sizes. Wet sieving would likely alleviate any indiscretions.
8 ACKNOWLEDGEMENTS
I would like to thank A/Prof Rolando Orense for his guidance and enthusiasm over the duration of this project. A special mention should be made for the late Dean Botica, who was a great leader and mentor, imparting a great deal of knowledge and experience in the short time he worked with the author. He had encouraged the author to further his research and pursue the YGPC 2020.
REFERENCES
Arcement, B.J., and Wright, S.G. (2001). “Evaluation of laboratory compaction procedures for specification of densities for compacting fine sands.” Report FHWA/TX-02/1874-1, Centre for Transportation Research, University of Texas at Austin.
Blake, S., Charlier, B., Sutton, A.N. and Wilson, C. (2006). “The 26.5 ka Oruanui eruption, Taupo Volcano, New Zealand: development, characteristics and evacuation or a large rhyolitic magma body.”
Einav, I. (2007). “Breakage mechanics – Part I: theory.” Journal of Mechanics and Physics of Solids, 55(6), 1274-1297.
Ghanbari, A., Hamidi, A., and Abdolahzadeh, N. (2013). “A Study of the rock fill material behaviour in large-scale tests.” Civil Engineering Infrastructures Journal, 46(2), 125-143.
Hardin, B.O. (1985). “Crushing of soil particles.” Journal of Geotechnical Engineering, American Society of Civil Engineers, 111(10), 1177-1192.
Kikkawa, N., Pender, M.J., Orense, R.P., St George, J.D. and Matsushita, E. (2012). “K0 compression and stress relaxation of pumice sand.” Journal of Geotechnical and Geoenvironmental Engineering, 138(5), 625-628.
Lade, P.V., Yamamaro, J.A., and Bopp, P.A. (1996). “Significance of particle crushing in granular materials.” Journal of Geotechnical Engineering, 122(4), pp. 309-316.
Lee, K.., and Farhoomand, I. (1967). “Compressibility and crushing of granular soils in anisotropic triaxial compression.” Canadian Geotechnical Journal, 4(1), 68-86.
Luxford, N.S. (1975). “Compaction test for aggregate studies.” National Roads Board, Wellington.
Marsal, R.J. (1967). “Large-scale testing of rock fill materials.” Journal of Soils Mechanics and Foundations Divisions, 99.27-43
Orense, R.P., Pender, M.J., and O’Sullivan A.S. (2012). “Liquefaction characteristics of pumice sands.” Department of Civil & Environmental Engineering University of Auckland, EQC Project 10/589, 5-10.
Pender, M.J., and Robertson, T.W. (1987). “Edgecumbe Earthquake: Reconnaissance Report.” Bulletin of the New Zealand National Society for Earthquake Engineering, 20(3), 201-249.
Wesley, L.D (2001). “Determination of specific gravity and void ratio of pumice materials.” Geotechnical Testing Journal, 24(4), 418-422.


