ABSTRACT
On 23rd January 2019 a section of the Clifton beach coastline in Hastings collapsed. Approximately 25,000 m3 of rock fell from between 60 m to 110 m above beach level. Two tourists walking the popular route to the Cape Kidnappers Gannet Colony were seriously injured when swept out to sea. Fortunately, both survived.
The Hastings District Council immediately closed beach access east of Clifton through to Cape Kidnappers to all users, and commissioned Stantec to provide an initial incident response and undertake ongoing monitoring to provide accurate data for a qualitative landslide hazard and risk assessment.
Rockfall and debris avalanches are a common occurrence along this coast and ongoing activity has occurred since 23rd January 2019 at this location and from other cliffs along the beach. This is not the first time a landslide has struck a beach user, with previous instances of landslides impacting vehicles and several near-misses.
Detailed volumetric change analysis has been done using a drone to capture repeated photogrammetric survey of the coastline, with data reduced to NZGD2000 datum. This data has been used by Stantec to undertake a comparative analysis to identify and quantify ongoing landslide and rockfall activity from sources bigger than 100 mm, and where these impact on the beach.
Further to the initial landslide assessment, Stantec was commissioned to undertake similar quantified comparison of survey data for approximately 8 km of coastline. Comparison of these surveys, four months apart, successfully identified and quantified many areas of active rock fall and land-sliding.
Introduction
On 23rd January 2019 a 90m wide section of the coastal cliff above the Clifton beach coast-line in Hastings District (Figure 1) collapsed in a debris avalanche. Approximately 25,000m3 of rock fell from the cliff 60-110 m above the beach. The debris extended 75 m out to sea and was 125 m wide on the beach at the base of the cliff (Figure 3). Two tourists walking the popular route to the Cape Kidnappers Gannet Colony were seriously injured when they were swept out to sea. Fortunately, both survived.

1km
North
Figure 1: NZ Topomap Excerpt – arrow points to the Cape Kidnappers Landslide location
This event was well publicised in national media, for example: https://www.stuff.co.nz/environment/110134954/images-of-cape-kidnappers-rock-fall-emerge
This website includes the following Figure 2.

Figure 2: Web Image captures the moment a cliff collapsed at Cape Kidnappers.
The Hastings District Council has documented the on-going rockfall hazards to aid the ongoing management of the hazards to beach users. This includes the drone photography and the photogrammetric model produced from drone imagery. https://www.hastingsdc.govt.nz/hastings/beaches/cape-kidnappers-landslide/
Stantec was initially approached to provide technical advice on the potential for ongoing failure at the landslide site to aid and inform the initial risk management strategy developed by the Hastings District Council. This work was subsequently extended to include the collection and analysis of data to quantify the size and frequency of ongoing rockfall activity along Clifton Beach between Clifton and Cape Kidnappers (Figure 1).
Survey Comparison Tool Selection
Stantec undertook analysis using Cloud Compare software, which is a 3D point cloud and mesh processing software, part of the Open Source Project. http://www.cloudcompare.org/
Comparisons between topographical surfaces can be undertaken using GIS software. However, GIS packages often undertake volumetric comparison using pseudo-3D (“2.5D”) processes, by measuring the vertical distance between surfaces to provide metrics. The use of “2.5D” process was considered unsuitable at this location because the significant overhangs present along the cliff would have created large ‘blind’ spots and reduced the quality of the subsequent analysis. Instead, it was decided to use a photogrammetric approach and use Cloud Compare software to take measurements into the vertical plane.
Using Cloud Compare we were also able to use a histogram analysis to filter the data and to remove points from the results where their variation from the prior survey was less than a selected value. Our qualitative assessment was that the differences (or noise) between surveys of areas with no change was generally less than 50 mm. By setting the filter function to hide data with a variation of less than 100 mm from the prior survey, areas of change (rockfalls) in the model could be identified with confidence while maintaining good sensitivity.
Survey Method
The Surveying Company (Hawke’s Bay) were commissioned directly by the Hastings District Council to systematically capture digital imagery of the cliff faces behind Clifton Beach from Clifton to Cape Kidnappers using drone technology and to undertake photogrammetric analysis of the imagery to produce a dense point-cloud model of the cliff face.
Photogrammetry is a process of creating a 3D relationship between multiple points identified from several different locations. The modern version of this process is undertaken using machine learning algorithms to identify key points visible in photos from a minimum of three locations, and trigonometrically confirming the spatial relationship of these points. The resulting dense point clouds can be hundreds of points per square metre. By including the surveyed position of enough visible ground control marks in the process, the model can be made to hinge on these known locations, and a true-scale model can be produced to a known datum.
The Surveying Company used highly accurate Post Processed Kinetic (PPK) GPS positioning of the drone increasing the accuracy of the model. They used the ground control points to quantify the accuracy of their survey results. Comparison between the traditionally surveyed positions of the redundant ground control and the modelled positions of these points confirmed that the dense point cloud model had a root mean square (RMS) accuracy of 50 mm or better.
The Surveying Company describes their process here: https://www.surveying.net.nz/services/aerial-survey-services/mapping-clifton-beach/.
Repeat Surveys of the 23rd January 2019 Debris Avalanche Site
The Cape Kidnappers debris avalanche was repeatedly surveyed over a period of four months by the Surveying Company who produced and provided the dense point clouds to Stantec. The first survey was on 28th of January, and the last on 3rd of May, with a total of ten surveys. Stantec used Cloud Compare software to detect changes between the successive point cloud models provided by the Surveying Company. Over this period, further debris avalanches and rockfalls were observed or detected from the cliff face near the 23rd January 2019 debris avalanche. The calculated volume losses from the cliff face between successive surveys are listed in Table 1.
Table : Cliff face volume losses between surveys near the site of the 23rd January 2019 debris avalanche.
| Survey period | Solid Volume Loss (m3) |
| 2019-01-25 – 2019-01-28 | 350 |
| 2019-01-31 – 2019-02-05 | 8000 |
| 2019-02-05 – 2019-02-08 | 2500 |
| 2019-02-08 – 2019-02-22 | 275 |
| 2019-02-22 – 2019-03-04 | 40 |
| 2019-03-20 – 2019-04-03 | 7850 |
The volumes of these debris avalanches and rockfalls were quantified in the Cloud Compare software described earlier. The elevation views of the cliff face showing were these losses occurred on the cliff face are shown in Figure 3.

Figure 3: Elevation views of cliff face volume losses between surveys near the site of the 23rd January 2019 debris avalanche (hashed outline on initial figure).
Repeat Surveys of the 8 km of Clifton Beach Coastline
Following on from analysis at the 23rd January 2019 debris avalanche, Stantec was asked to provide an assessment of the rockfall locations, sizes, frequency, and area impacted for the 8 km of coastline between Clifton (Clifton Motor Camp) to Cape Kidnappers (the gannet colony).
The Surveying Company undertook a systematic survey of the entire coastline between 8th March 2019 and 10th April 2019. A second systematic survey was undertaken some four months later between 31st July 2019 and 11 September 2019. This contrasts with the more frequent survey intervals of 3-14 days undertaken for the Cape Kidnapper Landslide in Figure 3. The surveys had to be undertaken under similar conditions of low tide, easterly sun and overcast conditions to create models that would allow comparison between surveys.
Again, the Surveying Company who produced and provided the dense point clouds to Stantec. Stantec used Cloud Compare software to detect changes between the successive point cloud models provided by the Surveying Company. Stantec located and calculated volumes for 129 sites where material was lost from the cliff face () over the 8 km length of the survey. The number of debris avalanches and rockfalls captured by the more frequent and more closely spaced in time surveys of the area near the 23rd January 2019 debris avalanche indicate that at least 129 rockfall or debris avalanches occurred along the full 8 km length of the cliff. The actual number will probably be greater as from experience with the Cape Kidnappers landslide site, it is possible that an area of loss from the cliff face may be the result of several individual failure events.
Table 2: Volume failure location counts
| Nominal Failure volume (m3) | Number of locations |
| 1-10 | 60 |
| 10-100 | 47 |
| 100-1000 | 16 |
| 1000-10,000 | 5 |
| >10,000 | 1 |
* Features less than 1m3 were not counted
An example of one of the nine sectors that were surveyed is shown in Figure 4, with the locations of significant volume change circled is shown on the Figure 4. This figure includes both the significant areas of loss in the initial 10 week survey period of the Cape Kidnappers Landslide (main hot spot) together with the other smaller features along this larger reach during the total four month survey period.
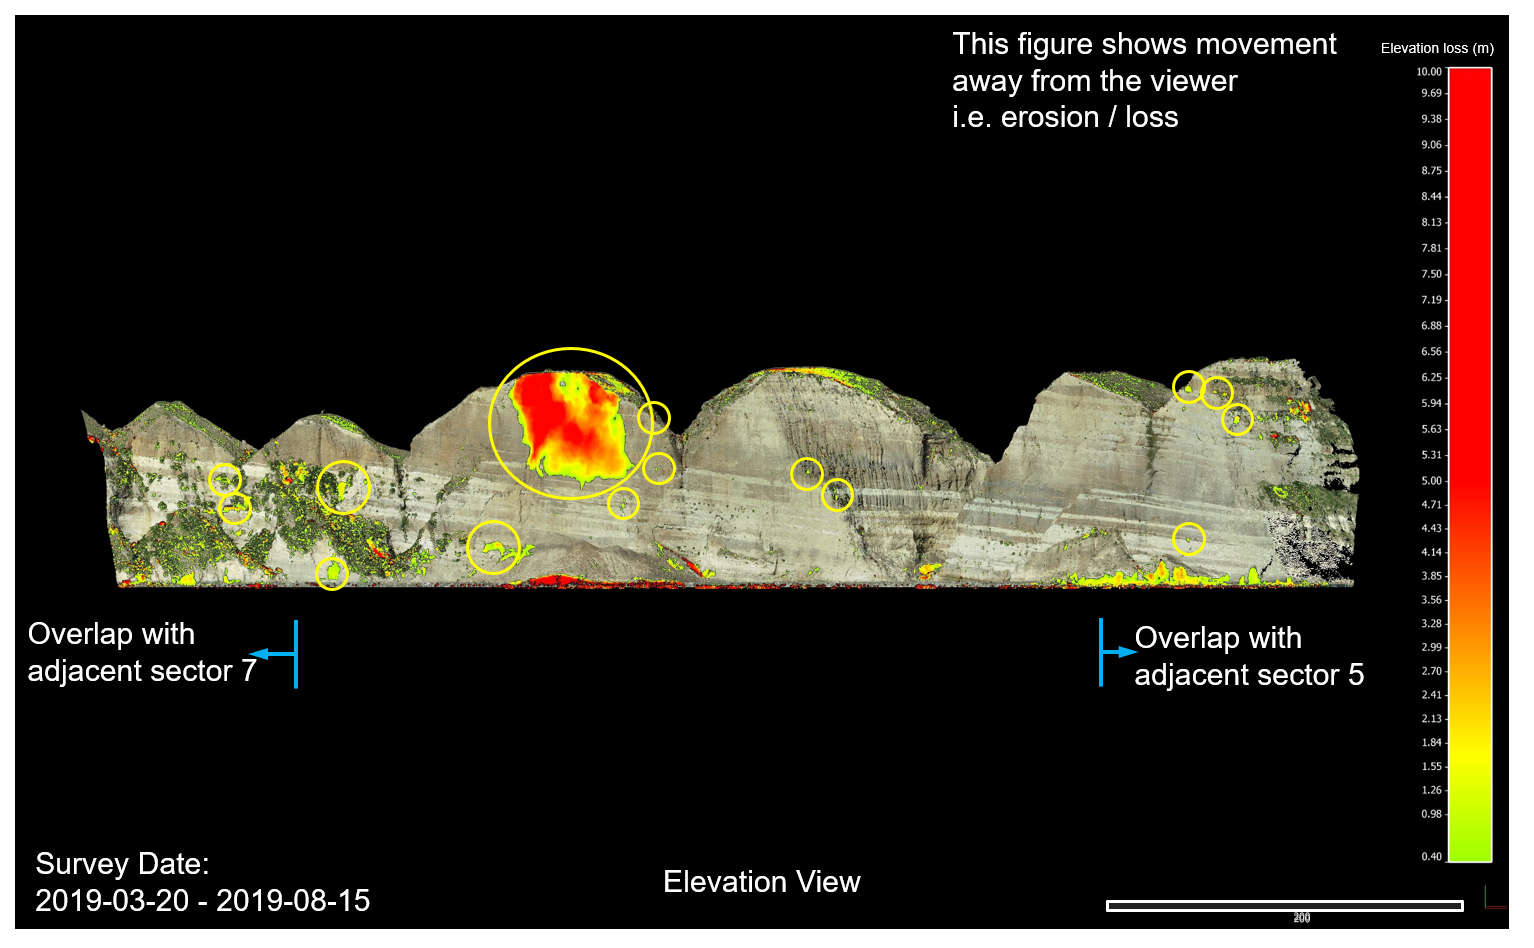
Figure 4: Example of volume failure locations from the global survey. The area of loss highlighted is in the sector with the 23rd January 2019 debris avalanche.
Alternative Technologies / Limitations
Direct LiDAR measurement from low-altitude fixed wing manned aircraft was suggested as a potential option. However, this method generally provides a less-dense point cloud in the order of 15-20 points per square metre and can have difficulty measuring overhanging or vertical features.
Reflector-less terrestrial laser scanning could not be undertaken because a stable platform at the necessary distance from the cliff was not available (this equipment cannot be set-up to operate form a boat). However, reflector-less terrestrial laser-scanning techniques were successfully used to monitor slope failures on coastal cliffs where a stable platform that could be repeatedly occupied was available following the Christchurch earthquake.
The limitations of the used photogrammetric modelling include that it is not a direct measurement technique, but appropriate use of ground control verification can confirm what RMS accuracy was achieved during processing. Photogrammetry can provide noisy models when dealing with highly reflective or low contrast surfaces. In the case of the Clifton Beach rock face, there are no highly reflective surfaces, and there is high detail and contrast, resulting in an excellent dense point cloud. Vegetation can often occlude parts of models as photogrammetry cannot model any point that is not visible in a minimum of at least three photographs.
The points clouds produced in the photogrammetric modelling process were not cleaned or classified in this instance so there was some persistent gaps in the surveys where vegetation was present, or grew between surveys. Vegetation creates apparent noise in the cloud-to-cloud comparison which has to be filtered out qualitatively by inspection. An example of this can be seen in Figure 5.

Figure 5: Example of vegetation noise in the analysis
Classification algorithms must be trained accurately if they are to be relied upon for removing vegetation, otherwise significant post processing must be allowed for manual removal of such features.
Conclusion
Accurately positioned aerial photography with drones can be undertaken with relatively affordable equipment.
Dense point cloud models produced by photogrammetry can achieve an absolute accuracy of 50mm or better with high-quality GPS positioning and ground control.
This resolution of data is enough to confidently identify changes in face geometry down to 100mm.
Photogrammetric surveying using baseline and repeat surveys is a useful tool to quantify rockfall hazards affecting routes and infrastructure. A route or site should be surveyed initially to acquire a baseline photogrammetric data for comparison with subsequent data collection activities. This process will provide data that can inform the assessment of rockfall hazards.