The graph in Fig 1, taken from Kaipara District Council’s May 2000 “Engineering Code of Practice for Land Subdivision and Development” illustrates the way in which soil Runoff Coefficients may vary according to (i) ground cover and (ii) rainfall intensity (mm/h).

Fig 1 – Runoff Coefficients vs land use and rainfall intensity [ex USDA handbook]
Runoff Coefficients are most obviously of interest to agricultural scientists and farmers, particularly re irrigation, but can also have Engineering consequences.
Surface runoff occurs when rainfall intensity exceeds a soil’s Maximum Infiltration Rate, – MIR – ie when the rate at which rain arrives on a soil surface exceeds the rate at which it can soak into that soil. Specifications of stormwater pipes and channels – including culverts – are calculated by combining the two sets of information, Runoff Coefficients and Rainfall Intensity. Runoff coefficients usually refer to large areas – whole catchments or sub-catchments – while Infiltration rates usually refer to small areas. Ground cover on large areas is what the graphs in Fig 1 refer to.
However, variations of MIR with ground cover on smaller areas can also be of Civil Engineering interest. For example, on some soils it has been found that where the soil surface has been trampled intensely (such as in gateways between paddocks) the MIR can be much lower than in nearby grazed areas. Hoofprints in areas heavily trampled by stock can remain full of water for days after rain stops, ie Runoff Coefficient tends to 100% and MIR tends to zero. By contrast, in areas which animals couldn’t get to[1] MIR can be much higher than in normally-grazed areas.

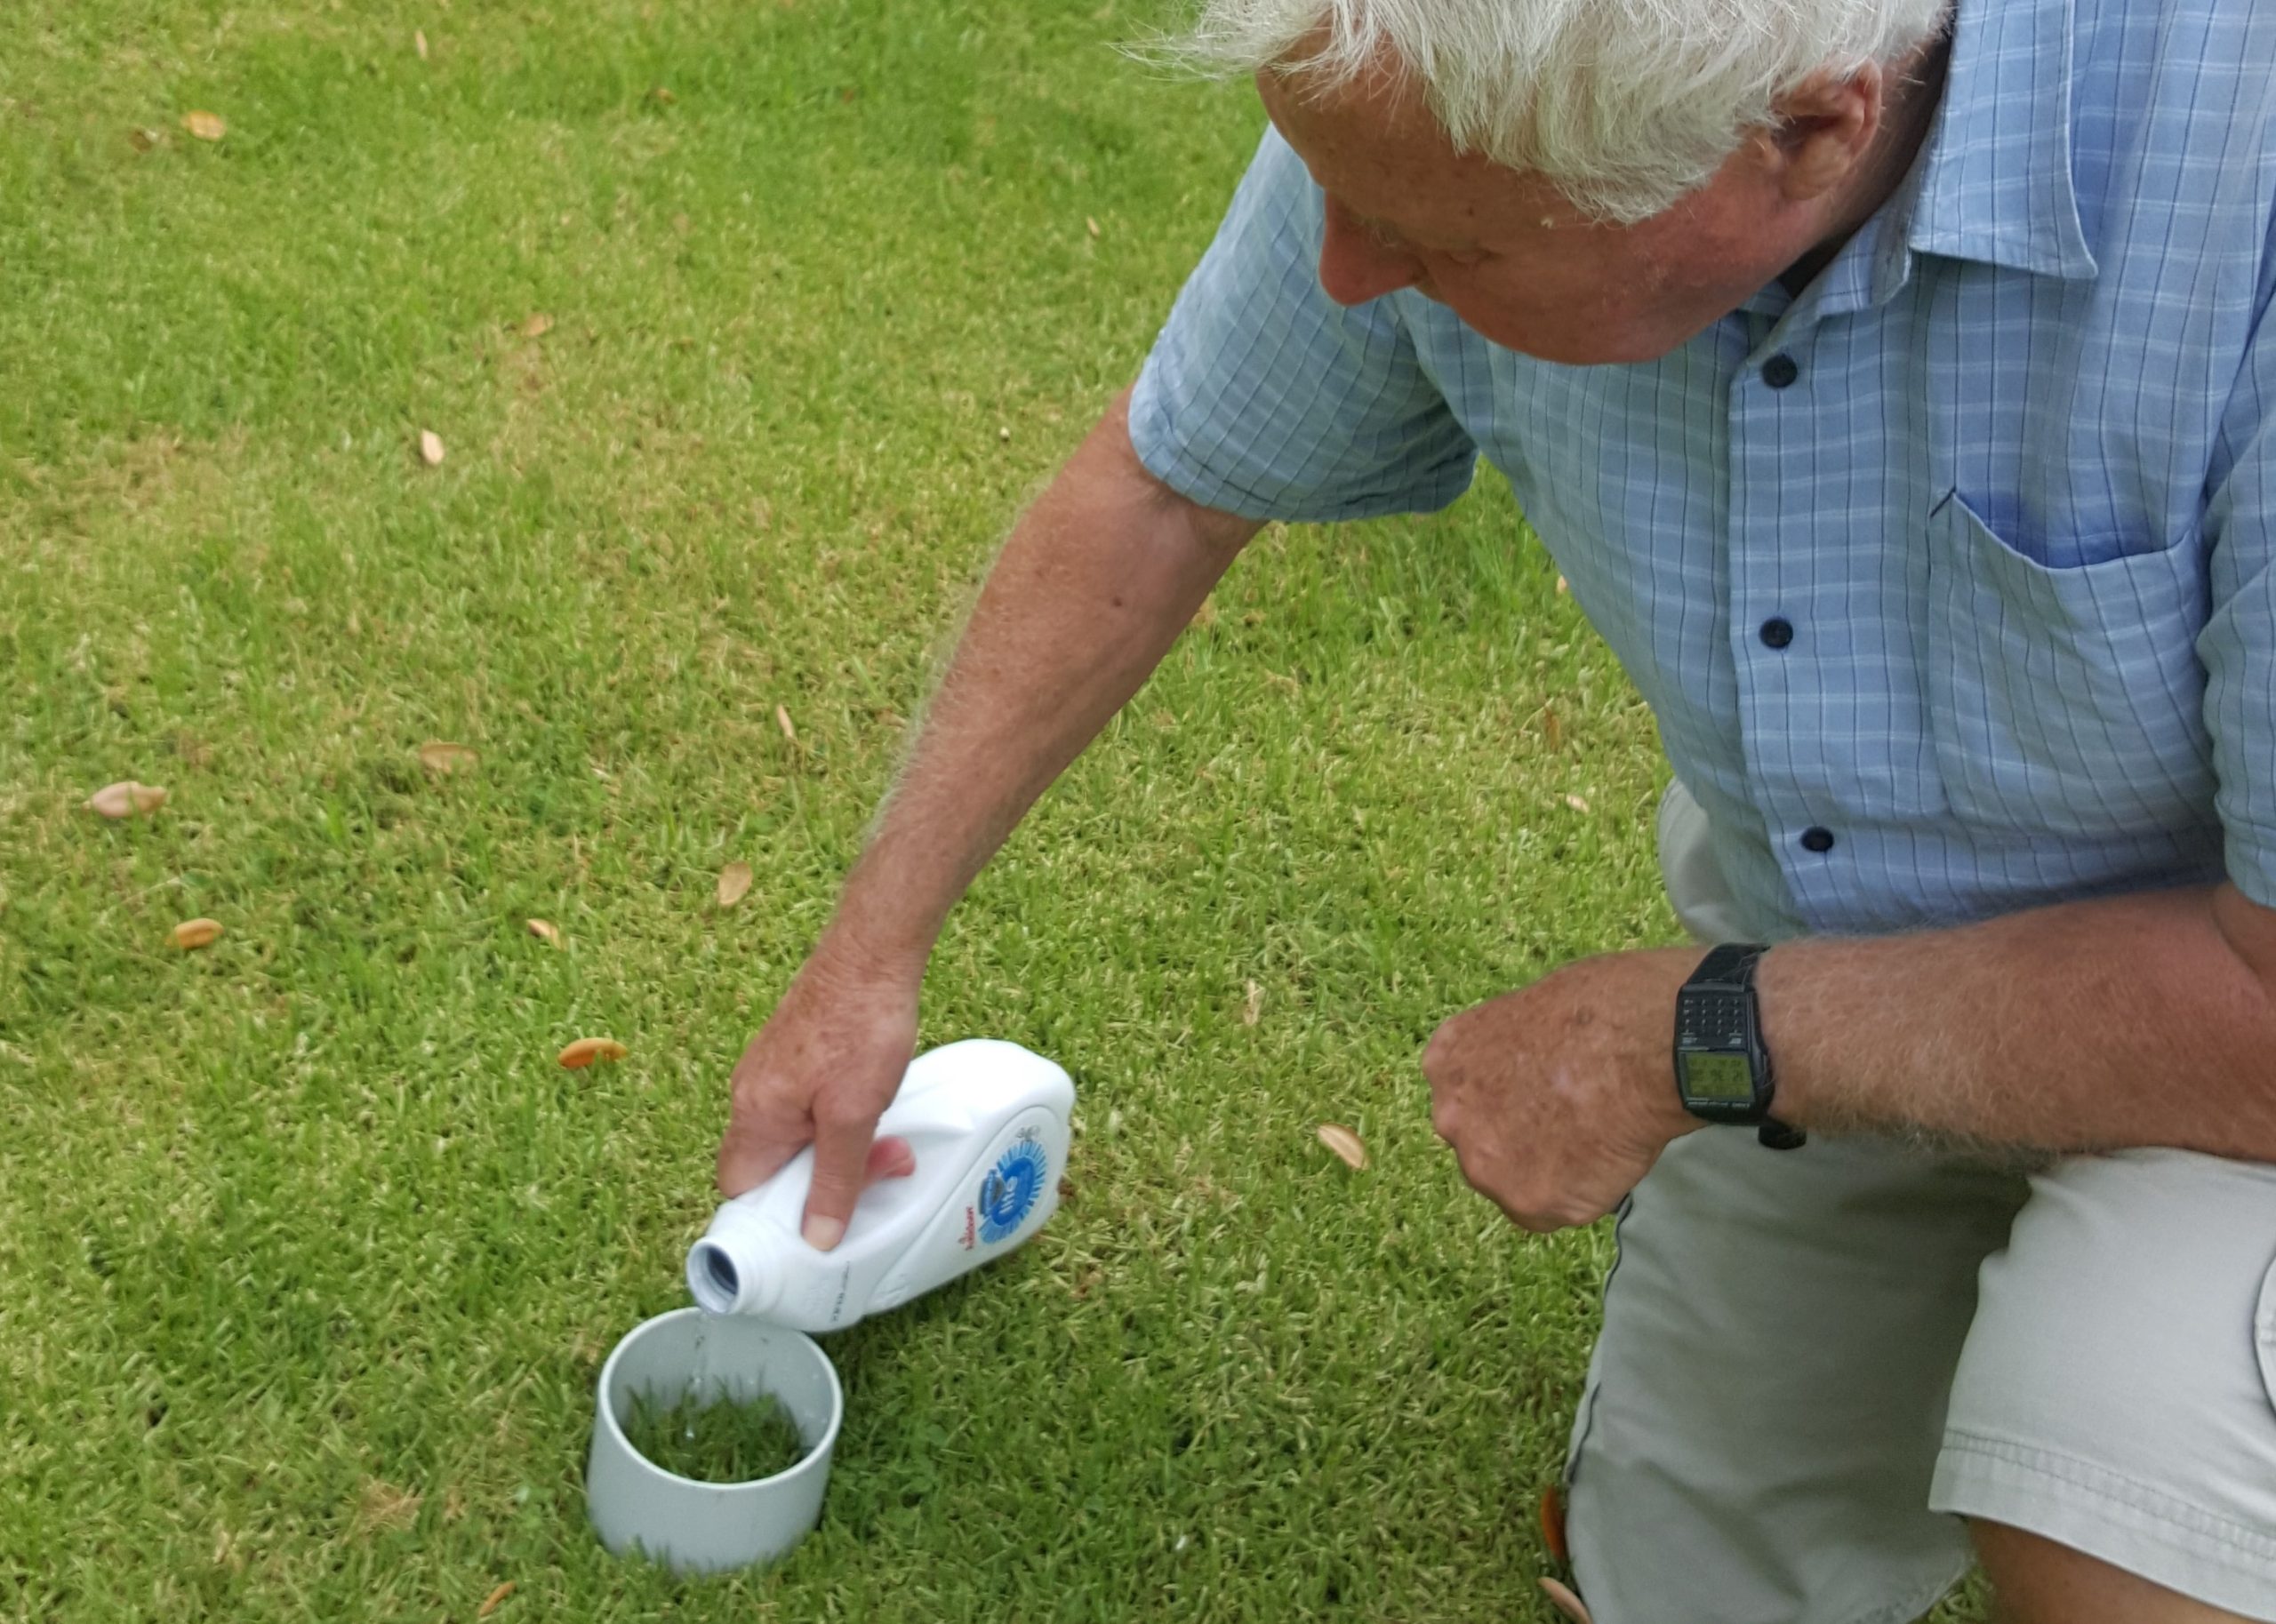
Fig 2 “Hawley Infiltrometer”
Measurements are made by pouring water into the pipe just fast enough to keep a free water surface one millimetre above the ground surface[2]. On some soils MIR can vary by > 50% over small distances, so that applying arithmetic to a few measured values is a frustrating (and potentially misleading) activity. An awareness of how it can vary over short distances (and from time to time as fences are moved or machinery parked etc) can be helpful in the design and post-failure analysis of steep road batters etc. This not only in pumice soils (see below) but in sands which can have very high infiltration rates where grassed and much lower rates where dust has accumulated. Indeed it can be true on almost any soil.
Pumice country
Changes in MIR with stocking density can be spectacular in pumice soils. Measurements on a pastoral farm near Taupo showed values in heavily trafficked gateways reduced to 1/10th of their open paddock values, while those measured in areas where stock couldn’t graze (fenced –off areas) were 10 times the open paddock values – so the variation covered a factor of 100.
This can be a precursor to gully formation. Where unprotected by vegetation pumice commonly offers little resistance to scouring – and yet may have high strengths. This is shown by gullies where scouring has left vertical cut faces several tens of metres high, see Fig 3. High flows may be initiated by upslope changes in land use such as conversion of areas of scrub to pasture or by intensification of grazing. Scour may be regarded as very small scale “incremental failure”. High stream flows may be caused by upslope changes in land use such as conversion of areas of scrub to pasture or by intensifications of grazing.

Fig 3 Pumice gully formed by scour by a small stream. Stable vertical “cut” demonstrates high strength in shear in spite of low resistance to scour.
Another form of failure in pumice country which can be stimulated by a change in infiltration rate coupled with variations in permeability is tomo formation, see Fig 4

Fig 4 Tomo formation in pumice, and possibility of resulting pulse of high flow in roadside drain having engineering consequences such as failure of soil around inadequate culvert.
Tomos[3] can be found running from high Infiltration rate areas to exits at lower levels. The tomos can begin to form at their exits and work back up to a patch with high infiltration rate. Analysis would more properly begin with consideration of a “flow nets” rather than slip circles. Very high flows from tomos (such as during intense rainstorms) can lead to very high flows in roadside drains which have been known to scour out culverts and form gullies across roads, Fig 4.
Sand country – stormwater management in urbanised areas
An example of the Engineering significance of infiltration rate in sand country may be seen in a recently urbanised area near Mangawhai Heads where Aeolian sand extends down in places to at least 8m – the maximum depth explored with a hand auger –
The uniform grain sizes at the various deposition places give rise to high infiltration rates and permeabilities.
An obvious feature of the ground which was about to be urbanised at Mangawhai was the absence of scour by overland flow on the roadside drainage channel on Molesworth Drive. This suggested that the sand had an MIR higher than the maximum precipitation rate. This suspicion led to testing with an improvised infiltrometer (Fig 2) comprising a short length of plastic down-pipe and a one-litre milk bottle. By measuring how long it took for the circular area of soil surface defined by the pipe to take in a litre of water, measurements of MIR were obtained. (The pipe was pushed one or two millimetres into the soil to ensure all flow began as vertical flow, and the lower end of the pipe was sharpened to allow it to be pushed in easily.)
In this particular Mangawhai setting the measurements showed that a conventional piped stormwater system was not needed for RoWs (rights of way) and roof-water tank overflows if the tanks were fitted with adequate detention volumes. Perforated draincoil soakage lines were installed at shallow depth on individual Lots. For RoW runoff vertical 300mm pipes 3m deep not only worked well but trapped major inputs of “fines” such as cement washings formed during formation of “exposed aggregate” RoW surfaces and at a later date topsoil from a Lot development with poorly managed earthworks. Measures could then be (and were) taken, to intercept those unwanted inputs to the Estuary.
Silt or clay country – ungrazed areas downslope of grazed areas
It is common practice for farmers to build fences to keep stock from straying onto steep roadside batters. There is commonly a strip of ungrazed ground between the fence and the top of the batter, see Fig 5. Commonly this becomes covered in rank grass which has a higher infiltration rate than the grazed pasture on the other side of the fence. Where the pasture is grazed overland flow may occur even in rainstorms which are not notably intense. Where the grazed ground slopes down towards the fence the surface water will be fed into the rank grass (shrubs, trees etc). There it will find a surface with higher infiltration rate. The underlying subsoils there will then receive water as though from a more intense rainfall than that actually occurring. Where the ground downslope of the fence has very steep ground below it, such as a cutting above a road or farm-track, conditions within the subsoils will encourage the development of conditions favouring a classical-type slip, or a slump or an earthflow. Such failures can leave a length of fence hanging in the air.

Fig 5 – Formation of classical landslip stimulated by changes in infiltration rate
Fig 6 shows a situation near Warkworth where a strip of forest (approximately 15m wide) has been left between the fence which has pasture upslope of it and the road cutting. The cutting has failed on many occasions over the last 20 years, some in rainstorms which were not notably intense. A factor leading to failure is likely to be reductions in infiltration rate on the grazed soils upslope leading to overland flow on them, with surface water flow increasing the intensity with which the soils in the forested area receive rainwater.
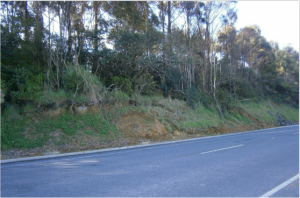
Fig 6 Example near Warkworth of mechanism shown in Fig 5 where vegetation downslope of fence includes trees.
I hesitate to point this out because the strip of forest has aesthetic value. One means of “control” in such situations can be the construction of swales which divert overland flow on the upslope side of the fence to places where it can be led safely to road level with reduced opportunity to soak into the soil between fence and road.
It may well be that the most economical way to reduce failures of the soil on the slope above the road may be to reduce the stocking intensity on the pasture on the slope above the bush, or surface swales may be more affordable. Who pays for the reduction in pastoral productivity, – the farmer or those responsible for road maintenance?
A more common situation is for the soil downslope of the fence to be a narrow strip of rank (ungrazed) grass. This situation is commonly evidenced by lengths of fencing hanging in the air above slip scarps, – the lower dashed line in Fig 5.
A very similar situation may be seen above sea cliffs where a fence has been constructed to prevent stock falling over the cliff into the sea. Again, a strip of ungrazed grass is left at the top of the cliff. Erosion at the base of the cliff by wave action – Fig 5- combines with high infiltration of the soil upslope of the fence.

Fig 7 Tunnel-gully-erosion developing in pasture beside Sandspit Road. Soils are “Whangaripo clay loam” which has been weathered from a siltstone bed within Waitemata Group sandstone.
Tunnel Gully Erosion is another common form of soil loss in pastoral hill country caused by infiltration into fine-grained (silty and clayey) soils. An example in Whangaripo clay loam beside Sandspit Rd is shown in Fig 7. The loss of soil is of obviously significant and potentially serious. This form of ‘failure’ includes scour of soil beneath a soil crust and flow through the crust. Shrinkage cracking on the soil surface is a common facilitator of infiltration. This is particularly likely to be seen where the soil has been bared of the shading provided by vegetation.
Tunnel gullies, of obvious concern to pastoral farmers, may also be of concern to Engineers where the degradation of water supplies, pollution of rivers, estuaries, lakes etc and the undermining of structures can be consequences. Removal of shading of soil surfaces (by hard grazing, earthworks or whatever) can promote shrinkage cracking and thereby cause tunnel-gulleying, particularly where it gets water to a layer of subsoil which has a low resistance to scour – which may in turn result from a lower clay content, lower cohesion and/or high permeability.
Because shrinkage cracking of the soil surface is an obvious route to a major increase in infiltration rates “shrinkage” (as well as scour) is a soil property behind this process.
The failure process may initially be dominantly the formation of the tunnels by transport of the finer fractions of soil. The tunnels may then collapse under gravity to form gullies.
There are obvious similarities between tomo formation in pumice soils (see Fig 4) and tunnel gully erosion in silty and clayey soils. Furthermore, in stratified alluvial soils where one stratum is much more erodible than its neighbours the formation by engineering works of easier access to, or exit from, a high permeability stratum may be sufficient to increase water velocities in it and thereby promote enlargement of the tunnel by scour.
Conclusions
Strength (with its underlying components of cohesion, angle of friction and dilatancy) and compressibility are not the only soil properties to be considered by Geotechnical Engineers as they try to avoid soil failures. Earthworks adjacent to pastoral land can accelerate the formation of tunnelling by storm water as well as trigger soil slips.
Soil shrinkage cracking, variations in infiltration rate and scour susceptibility are just three of many other soil properties which can have engineering consequences such as contributing to the initiation and control of failures of soils in and near to earthworks. An awareness of this can assist Engineers in the design and maintenance of storm water systems, water retaining structures, cut slopes, and in many other contexts.
Engineers wishing to broaden their grasp of correlations between forms of erosion and the soils which form in various geological settings would do well to read the NZ Erosion Classification (Eyles 1985) and the NZ Rock Type classification (Lynn and Crippen 1991) both of which were prepared to accompany the extended legends in the NZ Land Resource Inventory (NWASCA 1975 -79).
Consideration of soil infiltration rates, and particularly the measurement of Maximum Infiltration Rate (MIR) can enhance soil investigations, particularly those which cannot warrant laboratory testing of soil samples. The Hawley infiltrometer is very low cost and very portable!
Readers who have grasped the above will be able to explain why trout favour the Waitahanui stream over the Tauranga-Taupo.
References
Eyles G O 1985 The NNZ Land Resource Inventory Erosion Classification. Water & Soil Miscellaneous Publication No 85. Wellington
Lynn I H Crippen T F 1991 Rock Type classification for the NZ Land Resource Inventory. DSIR Land Resource Report No 10 Lower Hutt.
[1] Such as areas where farm machinery is parked or ones which are simply fenced off.
[2] On soils showing hydrophobicity a greater depth may give more consistent results.
[3] Subsurface tunnels.