ABSTRACT
The Cutter Soil Mixing (CSM) method was used for in-situ mixing of contaminated reclaim ground at Wynyard Point, in the waterfront area of Auckland, to facilitate the installation of a large diameter outfall pipeline. A soil/cement block was formed by the CSM working in a pattern to create a block of ground improvement 500m long and 3.7m wide. The pipeline bounded by the harbour seawall on one side and the ground improvement block on the landward side. The CSM panels were formed in reclaimed material comprising hydrocarbon contaminated dredged alluvial material, including hydraulically placed silt, sand and clay, overlying the end-dumped rock fill bund embankment surrounding the reclaim area. Panel interlock/overlap was critical for block integrity, and the rectangular profile of the CSM’s mechanical mixing head were ideal in this application. Column interface overlap could be back figured using the onboard computer system, which recorded inclinometer measurements to track panel verticality over the depth installed. Extensive testing was conducted by wet grab sampling, and a double PVC tube in-situ technique, with progressive strength results allowing water:cement ratio optimization during the works. Coring of panels was also conducted to add to the data base of results. Confidence in the quality of the treatment block was progressively gained through analysis of the installation parameters and the ongoing test results.
Keywords: Cutter Soil Mixing (CSM), Hydraulic Fill, Double Tube Sampling, Wet Grab Sampling,
INTRODUCTION
The $25M Brigham Street Outfall extraction project is an Auckland Council and New Zealand’s Ministry of Business, Innovation and Employment funded project. Wynyard Quarter where the Brigham Street is located had been constructed by placement of a rock bund along the perimeter of the reclaimed area and backfilled hydraulically in 1920s to 1930s.
Multiple rows of CSM panels were required, forming a gravity retention system in a narrow corridor over a 500m long section in reclaimed fill immediately adjacent to the harbour on one side, and bounded by an operating fuel storage tank farm on the other side. Wagstaff Piling was engaged for the CSM works. The pipeline would be laid underwater in a submerged trench alongside the gravity retaining wall, with the other side of the excavation protected by an existing concrete sea wall built on the original rock-filled bund wall. Interlocking CSM panels were designed as a gravity block, to retain the saturated low strength reclaim fill, and furthermore to limit ground deflection during the excavation and installation phase. Project overview and pipeline layout plan are presented in Figures 1a and 1b.
SITE GEOLOGY
The published geological map of the area indicates that the work area is underlain by hydraulic fill (reclamation land area), overlaying residual soils and rock of the East Coast Bays Formation. Reclamation to form the existing Wynyard Quarter occurred in the 1920s to 1930s, mostly hydraulically placed material including sandy silt with some clay and gravel within the perimeter rock bund comprising basalt boulders and cobbles. A rock faced sea wall was constructed on top of the perimeter bund and hydraulic fill was placed behind the bund to construct the access roads and reclaimed land. A cross-section of site geology at CSM location is shown in Figure 2.
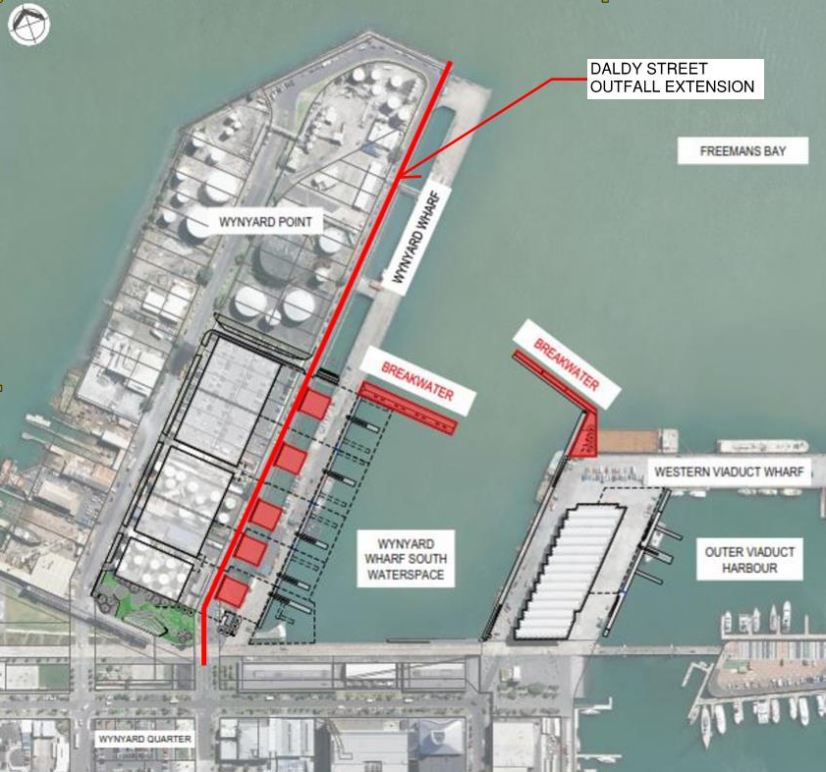

Fig 1a and 1b. Brigham Street outfall pipeline layout plan

Fig 2. Site geology cross-section profile at CSM location
DESIGN
The specified minimum Unconfined Compression Strength (UCS) of 0.75MPa for the block, with a target average 1.0MPa for CSM block, was required to provide the necessary stability at the time of pipeline excavation.
The specification required that “The average UCS from core sampling and wet grab sampling be based separately on a rolling average of the previous 10 results”. The block strength would be most closely estimated by averages rather than discrete test results, and so statistical analysis of sample UCS results was the focus of the test program and the analysis of strength. Clearly the CSM panels at 1m wide, all interlocking in a massive block, were much larger than 80mm diameter test samples. The small samples are prone to scale effects which lead to variability of strengths, and the challenge was to test sufficiently, and analyse the results, to provide the confidence on the fundamental requirement being Unconfined Compressive Strength (UCS).
Early laboratory mixing trials established a starting point for cement content at 200kg/m3, calculated by weight of the untreated soil volume (UTS), i.e. the theoretical panel volumes. CSM trial mixes were carried out to verify the initial design using GP cement. A schematic view of pipeline section with four rows of CSM panels are shown in Figure 3. CSM panels are designed to tie into the rock bund in the first row adjacent to the proposed pipeline. 8.5m deep CSM treatment is required for trench stability.

Fig 3. Schematic view of pipeline section with CSM panels
The design incorporated flexibility to address the risk of encountering the rock bund at higher levels along the CSM wall, in which case the stability of the block would be affected. Founding CSM panels on rock was deemed necessary to prevent general shear failure of soil block behind the wall. CSM wall displacement during different construction phases was analysed using finite element software, Plaxis. Localised additional CSM rows are designed beneath the pipeline to tie the CSM block into the rock bund at displacement sensitive locations. Design also limited excavation of pipeline trench to a 15m long section at each time to minimize the CSM wall deflection.
CONSTRUCTION METHODOLOGY AND CSM TREATMENT LAYOUT
Four rows of parallel interlocked CSM panels are considered to provide ground stability during pipeline excavation. A number of 2.4m long by 1.0m wide CSM panels are designed with 50mm overlap between ends of panels giving an effective panel length of 2.35m; and 100mm overlap between parallel panels giving an effective width of 900mm panels. Curing time between primary and secondary panels was generally within 1 to 2 days longitudinally, but more like 5 to 10 days would have elapsed for the cutting of intermediate rows. The cutting of secondary panels in the same row was still very easy for the CSM equipment, and although cutting of the secondary rows was more difficult after 5 to 10 days of strength gain either side, it was easily achieved by the CSM equipment. CSM panel layout is shown in Figure 4.
A Bauer RG19T with 1.0m wide cutters was used, with an Obermann OM600 batching plant set up in a central location. Grout comprising cement and water was batched and pumped up to 250m with a high pressure flushing pump Obermann DP130. GP cement was used, initially at a ratio by weight of water to cement w/c=0.6. This ratio was progressively increased up to w/c=0.85 as the project progressed, and performance was proven. The single-phase approach was used, meaning that cementitious grout was injected on the down stroke during cutting, with top up volume of grout also injected on the upstroke. This technique is favoured when the soil profile is soft/loose, and downward cutting time can be selected.

Fig 4, CSM panel layout
A starter trench at every CSM panel location was excavated to remove obstruction and underground services over the top 1.5m. Guide beams were used to set out CSM panels and a Bauer RGT 19 rig with BCM5 cutter installed the CSM panels to a typical maximum depth of 8.5m. The CSM rig during operation is shown in Figure 5.

Fig 5. Installation of CSM panels
Risks in Construction
The design took into account the expected variation in depth to reach the rock bund, which was targeted to be 8.5m, and the situation of higher rock level and founding of the panels. A flexible criterion was adopted for acceptance of panel depths, including a minimum section area of block, the requirement that CSM panels be in contact with the rock bund, and also be founded below the proposed pipeline bulk excavation level. If these criteria were met, then the stability of excavated trench would be satisfied. The success of this method was highly dependent on CSM rig’s capability to contact panels with the underlaying rock bund, and the flexibility of the CSM method proved extremely successful as the depth profile varied along the alignment.
Obstructions in the fill were predicted, including rock floaters, haul road material comprising rock fill, basalt boulders, and demolition waste material. In the case of hitting obstructions in the CSM panels, where obstructions could not be overcome by CSM cutter, the CSM rig would temporarily abort the panel, allowing an excavator to attempt the obstruction removal. The excavator bucket, quick hitched grappling tool, and a quick hitched drum cutter were available for use in removing obstructions. As the project progressed, the CSM rig itself proved generally most capable of penetrating obstructions, although at a price in tool wear and damage to cutter components.
If rock bund was found to be deeper than 8.5m, CSM panels were generally terminated at the designed depth of 8.5m. Wall displacements of up to 100mm during trench excavation were predicted by the design however, the actual measured displacement was around 10mm-15mm. In some areas with fuel storage tanks located behind the retention block, tighter deflection and settlement control was achieved by additional rows of CSM panels on the inside of the excavation to prop the block up against the buried rock bund itself.
Field Sampling Methods
Sampling methods adopted on this project were initially specified by the designers, although in the leadup to the works, techniques taken from previous recent experiences were included. The sampling techniques included the following;
- wet grab samples taken from 3m and 6m depth, 80mm diameter;
- double tube samples – plunged double walled PVC tubes with 100mm dia. inner;
- PQ size triple tube coring techniques following panel completion and approximately 28 days cure.
Individual samples were tested for UCS at various ages including 7, 14 and 28 days. Each sampling method is described as follows;
Wet grab samples
A purpose-built wet soil mix sampler was designed to collect wet soil mix samples from discrete depths, to a practical maximum of 6m. The sampler was progressively refined during the early stages of use to improve its efficiency and the quality of the recovered sample. The grab was lifted by an excavator and plunged into the wet mixed panel, its jaws were closed at the depth required, and the material lifted out to surface. The material was unloaded into a bucket, and then screened through 12mm mesh screen, ready for moulding. The moulds were 80mm x 200mm PVC cylinders, capped both ends. Material was generally flowable, and poured into these moulds, with tamping by vertical energy impact of the moulds themselves, for compaction and removal of entrapped air voids. The samples were individually labelled and left to cure on site. Set samples were transported to a certified laboratory for UCS and density testing, generally at 7 days, 14 days, and 28 days. The samples were extracted from the moulds trimmed at the ends to 160mm length for testing i.e. Length/Diameter=2.0
Double tube samples
The double tube sampling method comprises the use of 6m long PVC tubes, 100mm and 125mm nominal bore. The prefabricated double tubes, with a bottom seal between the tubes, were plunged into the wet soil mix, so that the wet sample would flow into the inner PVC. Generally plunged to 5.5m depth, the soil cement material would set inside the inner tube, and following set, the inner tube extracted by upwards pull, and cut into 1m lengths for transportation to the testing lab for subsequent curing, sub-sampling and UCS testing.
Core samples
A rotary drilling rig with PQ triple tube core barrels was utilized core through the panels, at least 28days old. Vertical and inclined cores were required to check panel overlap and jointing. The cores were stored in core boxes for a uniformity assessment, and for UCS testing. The uniformity assessment was described as follows;
- Core recovery – continuous core recovery shall be at least 85% over any 1.2m of core run. We note the core recovery was good and well within the required 85%.
- Percent treatment – over any 1.2m section of core sample, the lumps of unimproved soil shall not amount to more than 20% of the volume of the segment. Expressed another way, the sum of the dimensions of the lumps of unimproved soil shall not exceed 300mm in the 1.2m length of core. We note the percent treatment was good and well within the required 80%.
Different types of CSM sampling are shown in Figure 6.

Fig 6: Various types of CSM sampling
DATA ANALYSIS
With the project ongoing at the time of writing, over 160 No. UCS tests had been carried out on samples taken by the various sampling methods, to build up the results database. Density of the samples was also measured and recorded as part of the lab testing, and sample photos before and after testing were reported on the test certificates. The photos provided the opportunity to screen low strength results for possible inclusions negatively impacting the results. The test results were truncated to 95% confidence limits, to statistically exclude outlier results. Screening of results was also carried out by casting aside failures caused by lump size greater than sample diameter divided by 6. i.e. 80mm divided by 6 = 13mm. This screening was done by inspection of photos of tested samples, or where lab testing personnel had notated the unmixed soil lump size on the test certificate.
The range of raw data based on all UCS tests for various sampling method are presented in Table 1 and Figure 7 and show highly variable strengths across all sampling methods. This is typical of soil cement samples, and an ongoing project to identify the reasons for the variance, and to come up with ways to justify the variance, and to improve the sampling and testing methods to reduce the variance.
Table 1. UCS range of each type of sampling before result screening
| Sample Type | Days | # of results | Average Strength (MPa) | SD | COV |
| Shallow Wet Grab- 3m | 7 | 25 | 2.87 | 2.72 | 95% |
| Deep Wet Grab- 6m | 7 | 20 | 2.3 | 2.23 | 97% |
| Double Tube | 7 | 9 | 2.92 | 1.89 | 65% |
| Shallow Wet Grab- 3m | 14 | 24 | 3.96 | 3.37 | 85% |
| Deep Wet Grab- 6m | 14 | 19 | 3.17 | 2.76 | 87% |
| Double Tube | 14 | 12 | 2.58 | 1.55 | 60% |
| Shallow Wet Grab- 3m | 28 | 24 | 4.95 | 3.57 | 72% |
| Deep Wet Grab- 6m | 28 | 19 | 4.39 | 3.44 | 78% |
| Double Tube | 28 | 11 | 3.42 | 1.73 | 51% |
| Core Samples | 28 | 13 | 4.97 | 2.02 | 41% |

Fig 7:UCS test results before data screening
Data was screened to exclude low strength results justified by the test for excess soil particle size, and otherwise a statistical 95% truncation, led on to the narrowing of the variance, as shown in the lower standard deviation and narrowing of the coefficient of variation (COV), as noted in Table 2.
Table 2 – UCS Results summary after screening to indicate variability
| Sample Type | Days | # of results | Average Strength (MPa) | SD | COV |
| Shallow Wet Grab- 3m | 7 | 22 | 2.05 | 1.38 | 67% |
| Deep Wet Grab- 6m | 7 | 18 | 1.72 | 1.11 | 65% |
| Double Tube | 7 | 7 | 2.59 | 0.99 | 38% |
| Shallow Wet Grab- 3m | 14 | 22 | 3.14 | 1.98 | 63% |
| Deep Wet Grab- 6m | 14 | 16 | 2.52 | 1.27 | 50% |
| Double Tube | 14 | 8 | 2.46 | 0.73 | 30% |
| Shallow Wet Grab- 3m | 28 | 19 | 4.19 | 2.06 | 49% |
| Deep Wet Grab- 6m | 28 | 16 | 3.63 | 1.72 | 48% |
| Double Tube | 28 | 9 | 2.73 | 0.64 | 23% |
| Core Samples | 28 | 8 | 4.63 | 1.08 | 23% |
Following screening and truncation of the data set, trend shows more consistency between sampling methods, as indicated by the averages, SD’s and COV’s tabulated, and graphically shown in Figure 8.

Fig 8: UCS test results after data truncation and screening
The UCS results for the different sample types are trending closer with elapsing time, so the conclusion is that all sample types are representative of the mixed material.
Based on the above test results, the 28-day UCS average can be predicted as between 1.45 to 1.75 times the 7-day UCS average.
Frequency distributions were plotted for the UCS results, at differing ages, shown in Figure 9. By inspection, and also as calculated, the coefficient of variation (COV) reduces as time elapses. Early age variation is common, and the samples tend to normalize as time elapses.


Fig 9:Distribution of UCS from all CSM samples at various ages
The total unit weight of UCS samples were measured prior to UCS testing and are plotted for all different types of testing as shown in Figure 10. Wet density of samples ranged between 14.0 kN/m3 to 18.5 kN/m3. As shown in the plot, the density of double tube samples trends higher compared to the wet grab samples. Sample size appeared to impact the density, highlighting the scale effect of sampling and testing, and it has been proven many times that smaller scale samples under-estimate the properties of the larger CSM panels and block itself.

Fig 10: Distribution of Total Unit Weight in all CSM samples
Table 3 – Density Key Statistics
| Sample Type – Density Analysis | Days | # of results | Average Density (kN/m3) | SD | COV |
| Shallow Wet Grab- 3m | 7 | 23 | 16.7 | 0.06 | 3.8% |
| Deep Wet Grab- 6m | 7 | 18 | 16.4 | 0.09 | 5.3% |
| Double Tube | 7 | 7 | 16.9 | 0.07 | 4.1% |
| Shallow Wet Grab- 3m | 14 | 21 | 16.6 | 0.07 | 4.0% |
| Deep Wet Grab- 6m | 14 | 16 | 16.3 | 0.06 | 3.5% |
| Double Tube | 14 | 16 | 17.2 | 0.07 | 4.2% |
| Shallow Wet Grab- 3m | 28 | 21 | 16.6 | 0.06 | 3.6% |
| Deep Wet Grab- 6m | 28 | 16 | 16.3 | 0.06 | 3.8% |
| Double Tube | 28 | 10 | 17.0 | 0.07 | 4.2% |
| Core Samples | 28 | 13 | 17.4 | 0.68 | 3.9% |
Undisturbed samples obtained by coring and double tube sampling, show higher density compare to wet grab samples, most likely due to the tendency for fluid to migrate out of the mix via the panel side wall, under the hydrostatic pressure conditions in the wet panel, whereas the wet grab samples are sealed and do not permit this moisture loss. Fluid migration out of the soil/cement mix leads to denser and stronger in-situ material.

Fig 12. Distribution of UCS with Total Unit Weight
Plotting density against UCS in Figure 12, shows the trend of increased strength with increasing density, particularly in core samples. The depth effect on UCS and density of soil mix block is investigated and shown in Figures 13(a) and 13(b).


| Fig 13(a). Distribution of UCS with depth | Fig 13(b). Distribution of density with depth |
Higher strength and density were generally achieved with increased depth, particularly with cored samples, further underscoring the case that hydrostatic fluid pressure effects are a benefit to panel material strength at depth. We note this is likely to be the case more so in cohesionless material, than compared to cohesive material, clays and even layers with more fines.
DISCUSSION AND CONCLUSION
- Data analysis on the differing sample types established correlations and trends between the sampling methods, and the impact of other variables such as sampling depth, on the strength and the density of soil-cement panels forming the block.
- Early assessment of strength was based on 7day UCS averages, and a relationship was quickly derived with strength gain vs time out to 14 and 28 days, and allowed for progressive reductions of the cement content as the works progressed;
- Core samples (undisturbed samples) were denser and stronger with increasing depth, consistent with trends from other projects with single phase mixing in cohesionless material;
- Screening of wet grab mixture through a 12mm sieve size – this process was introduced part way through the testing program, so we suspect some understrength wet grab samples would have been included in the early wet grab data set;
- Variance in the results was evident, and typical of a soil mixing project, the variance was larger at the start, and began to narrow as the project progressed. Issues of training and gradual improvement in sampling and testing techniques normally see reduction in sample variance as the project progresses.
- The presence of obstructions in the fill led to cement content variation which was difficult to control. By this we mean that the flushing of cementitious slurry (single phase mixing) had to continue when obstructions slowed the penetration rate. This led to overdosing of some panels in the layer of the obstruction and would have led on to higher sample strength. An analysis of this aspect would be complicated, and has not been done yet, although with the project still ongoing, clearly analysis is required.
- Inclinometer casings placed in core holes were monitored and deflections measured were well inside design limits as the excavation and pipe laying progressed. This provided a level of confidence in the statistical approach to strength results analysis of individual core samples, and projection to an assessment of overall block strength.
- The project provided an opportunity to carry on with sampling and testing techniques developed previously, with the aim of better understanding how to verify the insitu soil/cement mixing, in order to satisfy the designer’s requirements, both on a project level, but also on the basis of ongoing improvement in sampling and testing.
REFERENCES
Claudia Kayser, Chris Grimes, “Daldy Street Outfall Extension Ground Improvement Design Report”, Wynyard Edge Alliance, 2019.
“Daldy Street Outfall Extension – Project Quality Plan”, Wagstaff Piling, 2019.
“Unconfined Compressive Strength Test Reports”, WPS Opus, Auckland Laboratory, 2019.